XRP Down 18%: Where Is the Bottom? November Price Prediction & Levels


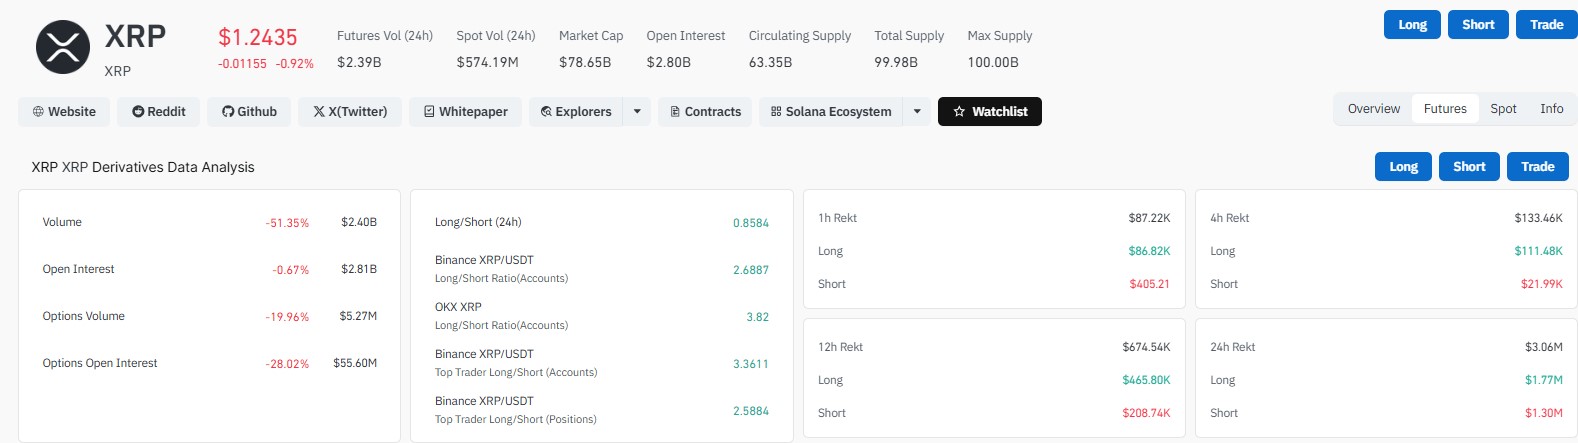
XRP is trading at $1.2435, down 0.92% in the past 24 hours. The coin has lost about 18.7% this month.
Price briefly dipped near $1.20 before buyers pushed it back to $1.25. Earlier in October, it touched a high of $1.5550.
Snapshot: Where the Coin Stands Now
Metric | Data |
Price | $1.2435 |
24h change | -0.92% |
Monthly change | -18.7% |
Market cap | $78.65 billion (5th largest) |
All-time high | $3.65 (July 17, 2025) |
Distance from peak | 65.8% below |
Yearly low | $0.9927 (August 16, 2026) |
Leverage Flush Clears Some Risk, Not All
The drop forced many traders out of borrowed positions. In 24 hours, the coin saw $3.06 million in liquidations.
Longs lost $1.77 million. Shorts lost $1.30 million.
Fewer leveraged longs left can mean less forced selling ahead. But a break below $1.20 could bring a fresh wave.
Derivatives data leans weak. The overall long/short ratio is 0.8584, which points to a bearish tilt.
Derivatives metric | Value | Change |
Futures volume (24h) | $2.39 billion | -51.35% |
Open interest | $2.80 billion | -0.67% |
Options volume | $5.27 million | -19.96% |
Long/short ratio | 0.8584 | Bearish bias |
Activity is cooling fast. Volume has nearly halved.
ETF Flows Turn Slightly Negative
ETF money has been a quiet support this year. Total net assets stand at $1.42 billion, or 1.79% of market cap.
Cumulative net inflow is $1.81 billion. Still, October 30 saw a daily net outflow of $496.50K.
Fund | Issuer | Daily flow |
XRP | Bitwise | -$693.55K |
XRPC | Canary | +$922K |
GXRP | Grayscale | -$724.95K |
XRPZ | Franklin | $0 |
TOXR | 21Shares | $0 |
Canary was the only fund adding money. The rest were flat or selling.
Network numbers look better. In Q3 2026, ETP net inflows rose 39.6% to $355.3M. Stablecoin supply on the XRP Ledger grew 25.2% to $1.03B.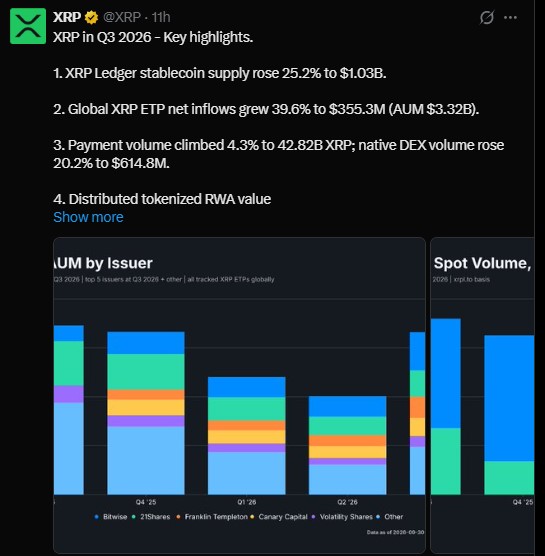
Chart Shows Bears Still in Charge
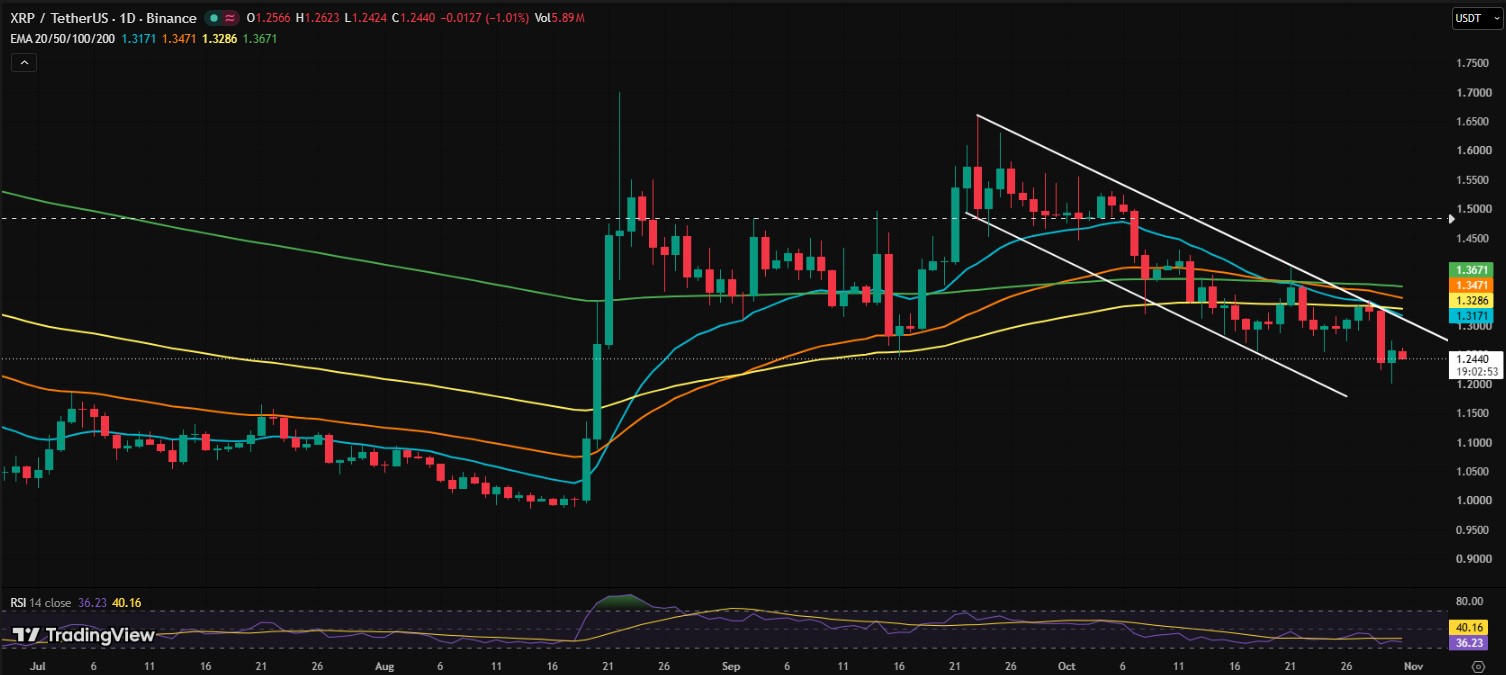
On the daily chart, price moves inside a descending channel. That means lower highs and lower lows.
The token sits below all four major moving averages. RSI is near 36, close to oversold but without a clear reversal sign.
EMA | Level |
20-day | $1.317 |
50-day | $1.347 |
100-day | $1.329 |
200-day | $1.367 |
Levels Traders Are Watching
A relief bounce could reach the $1.28 to $1.30 zone first. Failing there may send price back toward $1.20 to $1.18.
Scenario | Level | What it may signal |
Deeper drop | $1.10 | Breaking below $1.18 opens this door |
Key support | $1.20 to $1.18 | Buyers defended it recently |
Current price | $1.24 | Sideways, weak momentum |
First resistance | $1.28 to $1.30 | Relief bounce target |
EMA resistance | $1.32 to $1.37 | Trend reversal zone |
Upside target | $1.45 to $1.50 | Needs a channel breakout |
The $1 mark also matters. The coin closed at $0.9927 in August, then jumped to $1.45 days later. Buyers clearly cared about that level.
November Has Been Rough for XRP Holders
History is mixed. The token fell in three of the past five Novembers.
Year | November return |
2021 | -10.1% |
2022 | -12% |
2023 | +1.6% |
2024 | +279.2% |
2025 | -14.1% |
The 2024 rally followed the US election. Last November, the coin opened at $2.51 and fell as low as $1.82.
What Could Happen Next
The base case for November sits between $1.20 and $1.32. Cleared leverage and steady ETF holdings back that range.
A series of daily closes below $1.20, plus clear ETF outflows, would raise downside risk. A close above $1.40 could pull price back toward October highs.
Nobody knows the exact bottom. The data shows a market that is tired, not yet broken.
Disclaimer
This article is for information only and is not financial advice. Cryptocurrency prices are highly volatile, and you can lose money. Do your own research and speak with a licensed financial advisor before making any investment decision.