XRP News Today: XRP Price Prediction Shows Double Top Risks a 30% Crash to $1

XRP News Today: XRP Price Prediction Signals 30% Drop Risk Toward $1
XRP is down 8% and trading near $1.46 at the time of writing. The wider crypto market is also slipping, with total value below $3 trillion.
The latest XRP price prediction now points to a possible double top on the daily chart. If the pattern confirms, XRP could revisit the $1 level. Bulls still have several support zones to defend first.
This latest XRP news update covers the XRP/USD chart, derivatives data, liquidations, and ETF flows in one place.
What Is the XRP Price Today?
The token is trading at $1.4596 on Sept. 24. That is a drop of $0.1278, or 8.05%, over the period shown.
Here is a quick look at the key market numbers.
Metric | Value |
XRP Price | $1.4596 |
24h Change | -8.05% (-$0.1278) |
Market Cap | $91.67B |
Circulating Supply | 62.87B XRP |
Total Supply | 99.98B XRP |
Max Supply | 100B XRP |
Futures Volume (24h) | $7.45B |
Spot Volume (24h) | $1.47B |
Open Interest | $3.54B |
Futures volume is much larger than spot volume. That shows most of the trading action is happening in derivatives.
Why Is XRP Down Today?
The drop looks like a mix of a weak crypto market and heavy long liquidations. The total crypto market is below $3 trillion, and traders have been closing risky bets.
Derivatives data from the last 24 hours shows:
Trading volume fell 21.62% to $7.46B.
Open interest dropped 10.66% to $3.54B.
Options volume fell 22.01% to $8.20M.
Options open interest rose 2.45% to $115.25M.
Falling open interest means traders are closing positions. That often follows a sharp price move.
How Much XRP Was Liquidated in 24 Hours?
In XRP news today, liquidations reached about $31.48 million over 24 hours. Almost all of it hit traders betting on a price rise.
Timeframe | Total Liquidations | Longs | Shorts |
1 hour | $3.22M | $3.17M | $43.45K |
4 hours | $8.78M | $8.68M | $99.42K |
12 hours | $10.44M | $9.58M | $858.63K |
24 hours | $31.48M | $29.54M | $1.94M |
Long traders lost $29.54 million, while shorts lost only $1.94 million. Buyers were caught on the wrong side of the move.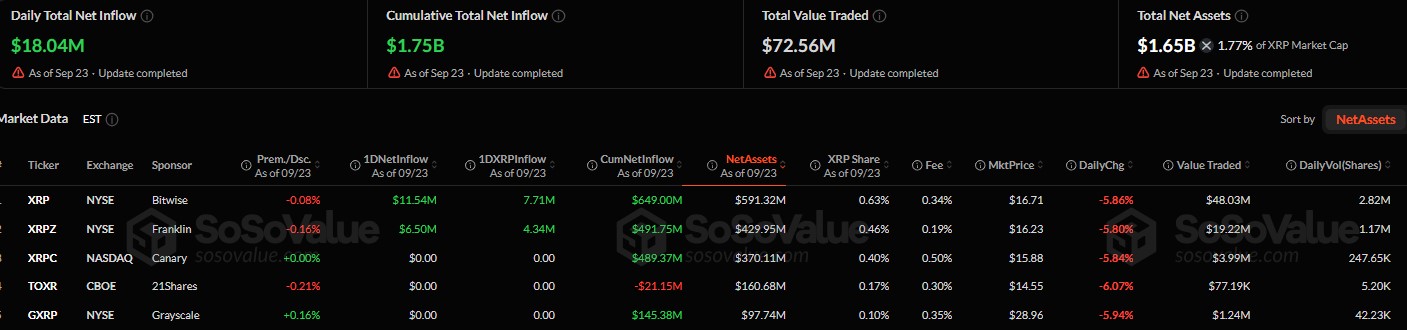
What Is the XRP Long/Short Ratio?
The overall 24-hour long/short ratio is 0.9022. A reading below 1 means slightly more short positions than longs across the market.
Account-based data on top exchanges tells a different story.
Exchange / Metric | Long/Short Ratio |
Binance XRP/USDT (Accounts) | 2.3933 |
OKX XRP (Accounts) | 2.72 |
Binance Top Traders (Accounts) | 2.8168 |
Binance Top Traders (Positions) | 2.497 |
Most accounts on Binance and OKX are still leaning long. That is a mixed signal. Many traders remain hopeful, yet the overall ratio has slipped under 1.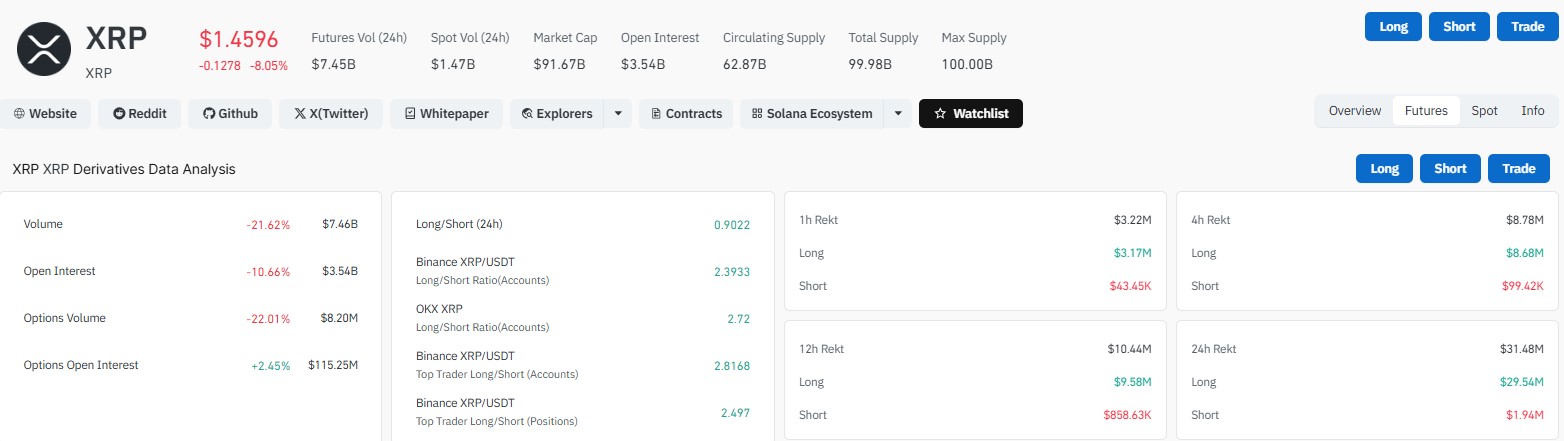
What Is the XRP Double Top Pattern?
A double top is a chart pattern that can signal a trend reversal. Price hits a resistance area twice, fails both times, then drops.
The token rebounded sharply from its August low near $1. The first peak formed earlier in September, when XRP rallied toward $1.55 to $1.60 and pulled back.
It then recovered and tested nearly the same area in late September. That may become the second top.
Both peaks stay below a wider resistance level near $1.65. Sellers have stepped in there before.
Will XRP Drop to $1? XRP Price Forecast
It could, but the bearish case is not confirmed yet. The key level to watch is the potential neckline near $1.285.
A daily close below that level would confirm the double top. Measuring the gap between the peaks and the neckline gives a target near $1.00.
That would be a fall of more than 30% from current prices. It would also erase most of the recovery since August.
Nothing is guaranteed here. Charts show risk, not certainty.
What Are XRP's Key Support and Resistance Levels?
Price still holds above its 20-day EMA. Several moving averages also form a support cluster below the price.
Indicator / Level | Approx. Value |
20-day EMA | $1.41 |
50-day EMA | $1.33 |
100-day EMA | $1.28 |
200-day EMA | $1.36 |
Double top neckline | $1.285 |
Resistance zone | $1.55 to $1.60 |
Major resistance | $1.65 |
Bearish target | $1.00 |
The 100-day EMA near $1.284 sits almost exactly on the neckline. That makes the $1.28 area very important.
Support looks dense between roughly $1.28 and $1.40. Bears must break through this zone before the $1 target comes into play.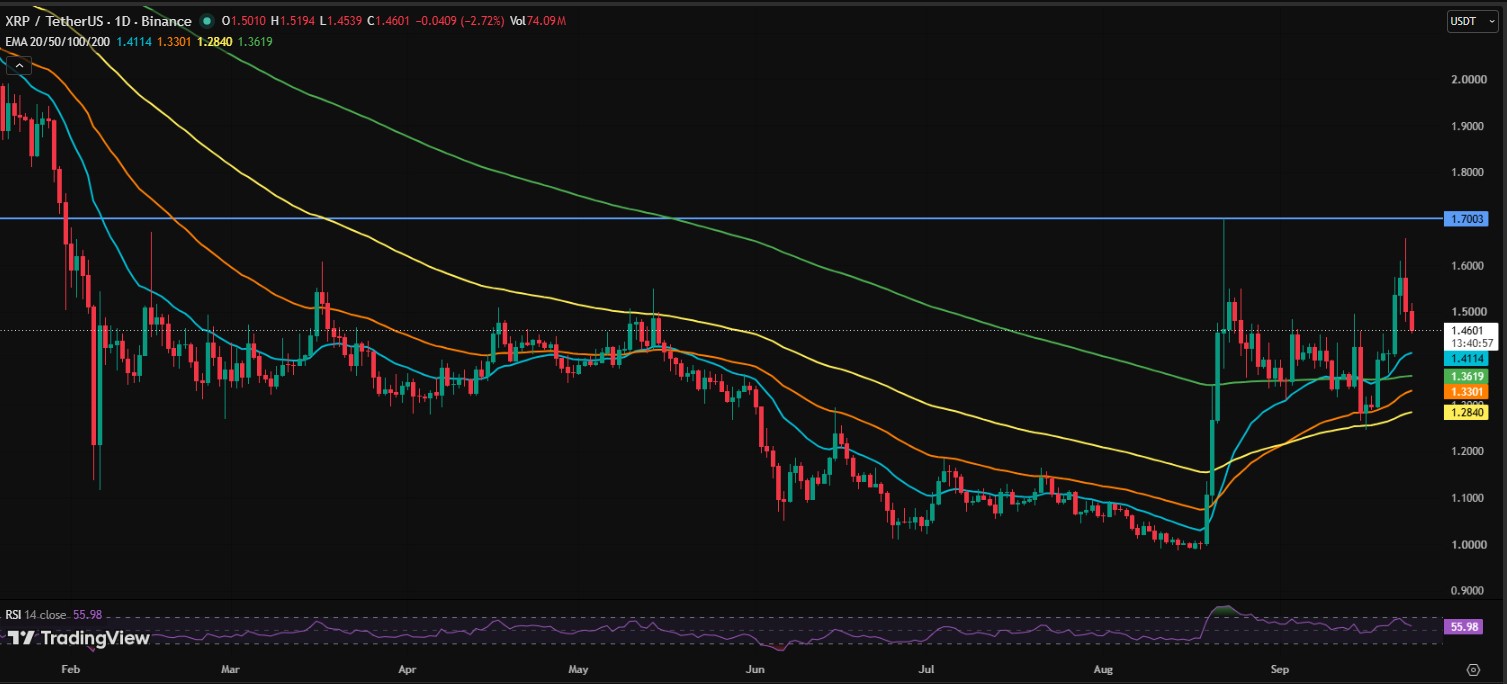
Is XRP Still Bullish Right Now?
The daily RSI is near 58. That is above the neutral 50 line, so bullish momentum has not fully faded.
Bulls could still cancel the bearish setup. A clear move above $1.60 to $1.65 would weaken the double top argument. Attention would then shift to higher resistance levels.
Until then, another rejection followed by a drop below $1.285 would raise the risk of a slide toward $1.
Are XRP ETFs Still Seeing Inflows?
Yes. Spot funds recorded $18.04 million in daily net inflows as of Sept. 23. Cumulative net inflows now stand at $1.75 billion.
Total net assets across the listed funds are $1.65 billion. That equals 1.77% of the market cap. Total value traded was $72.56 million.
Ticker | Sponsor | Daily Net Inflow | Cumulative Net Inflow |
XRP | Bitwise | $11.54M | $649.00M |
XRPZ | Franklin | $6.50M | $491.75M |
XRPC | Canary | $0 | $489.37M |
TOXR | 21Shares | $0 | -$21.15M |
GXRP | Grayscale | $0 | $145.38M |
Bitwise leads with $591.32 million in net assets. Franklin follows with $429.95 million.
Only Bitwise and Franklin saw fresh money on the day. Bitwise added 7.71M XRP and Franklin added 4.34M XRP.
Franklin has the lowest fee at 0.19%. Canary charges the highest at 0.50%.
Grayscale's GXRP trades at a small premium of 0.16%. 21Shares' TOXR has a discount of 0.21% and net outflows of $21.15M since launch. The other three funds had no inflows.
Funds are still attracting cash, yet the price fell. ETF buying alone did not stop the drop.
What Is the XRP Price Prediction for Today?
Two paths look possible from here.
Bearish case: Another rejection near $1.55 to $1.65, followed by a daily close below $1.285. That would confirm the double top and open the road to $1.
Bullish case: A strong break above $1.60 to $1.65. That would weaken the pattern and put higher resistance back in view.
For XRP today, traders are watching the $1.28 to $1.40 support cluster. How price behaves there will likely decide the next move.
Disclaimer
This article is for information only. It is not financial, investment, or trading advice. Cryptocurrency prices are volatile, and you can lose money. Always do your own research and speak with a licensed financial advisor before investing.

















