XRP Price Prediction: Can Bulls Defend $0.78 Before a Rally to $3.50?


XRP is slipping back toward the $1 line, and traders want to know where the selling may stop.
The token trades at $0.9615, up 0.50% in the past 24 hours. It is still about 75% below its all-time high of $3.842.
Analyst Ali Martinez thinks one more dip could come first. He points to $0.78 as a possible floor.
XRP Price Prediction: Weekly Chart Points to $0.78
Martinez sees a large ascending triangle on the weekly chart. He says it has been building since 2017.
The price is down more than 43% from its October high of $1.55, according to his post. He says that drop could reach the rising trendline near $0.78.
That is where he expects buyers to step in.
If $0.78 holds, he sees room for a bounce toward the flat resistance at $3.50. That level has capped the chart for years.
A weekly close above $3.50, followed by a retest as support, would confirm the pattern. Martinez says that setup could open a path toward $18.
That target is far from today's price. It is a long-term view, not a promise.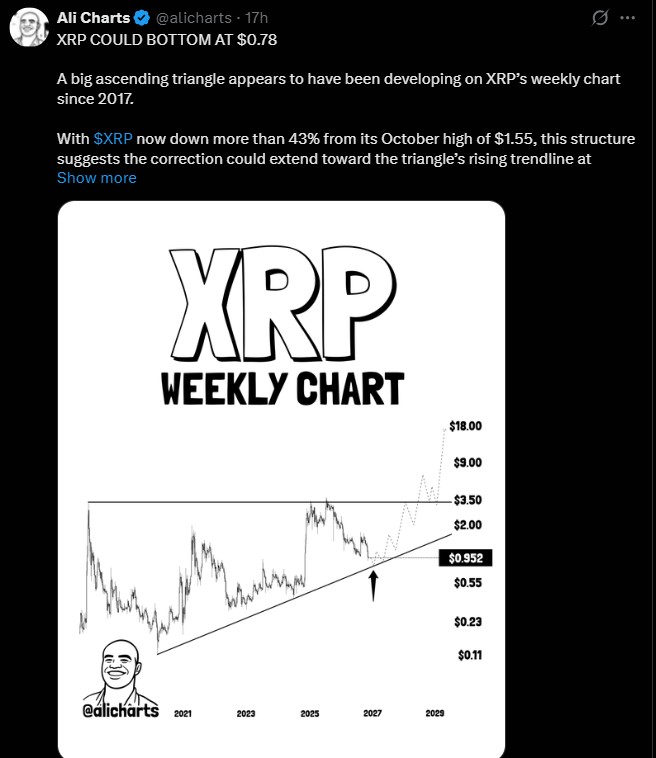
Cycle Study Looks Toward 2028 and 2029
Another chart watcher, ChartNerd, studied 13 years of cycles. His chart shows gaps of 1,492, 1,186 and 1,552 days between major turning points.
The average works out to about 1,400 days. His chart marks 2028/9 as the next big window.
He calls the current drop a 16-month bear market. He also calls the multi-year triangle breakout and retest a "historical reset," not the end.
His argument leans on Ripple's work with large global firms. First the foundations, then a repricing, he says.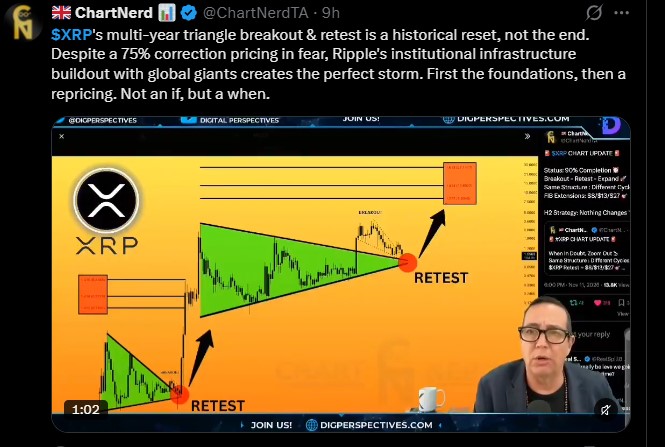
Cycles can repeat. They can also break. Timing is the hard part.
XRP Futures Data Shows Mixed Signals
Derivatives numbers paint a split picture. Here are the main readings.
Metric | Reading |
Price | $0.9615 |
24h change | +0.50% |
24h range | $0.9415 to $0.9767 |
Market cap | $61.09B |
24h futures volume | $2.30B |
Open interest | $1.99B |
Funding rate | -0.0048% |
24h liquidations | $3.34M |
Fear & Greed Index | 13 (Extreme Fear) |
The funding rate is negative. That hints at a slight bearish lean among leveraged traders.
Liquidations were small. Longs lost $2.07 million and shorts lost $1.27 million.
The taker buy/sell ratio is split. Binance reads 1.0276, which favors buyers. OKX shows 0.9903, Bybit 0.9262, Gate 0.8864 and Hyperliquid 0.9400, all below 1.
Spot volume is $517.36 million. ETF net inflow was $0 on Nov. 16.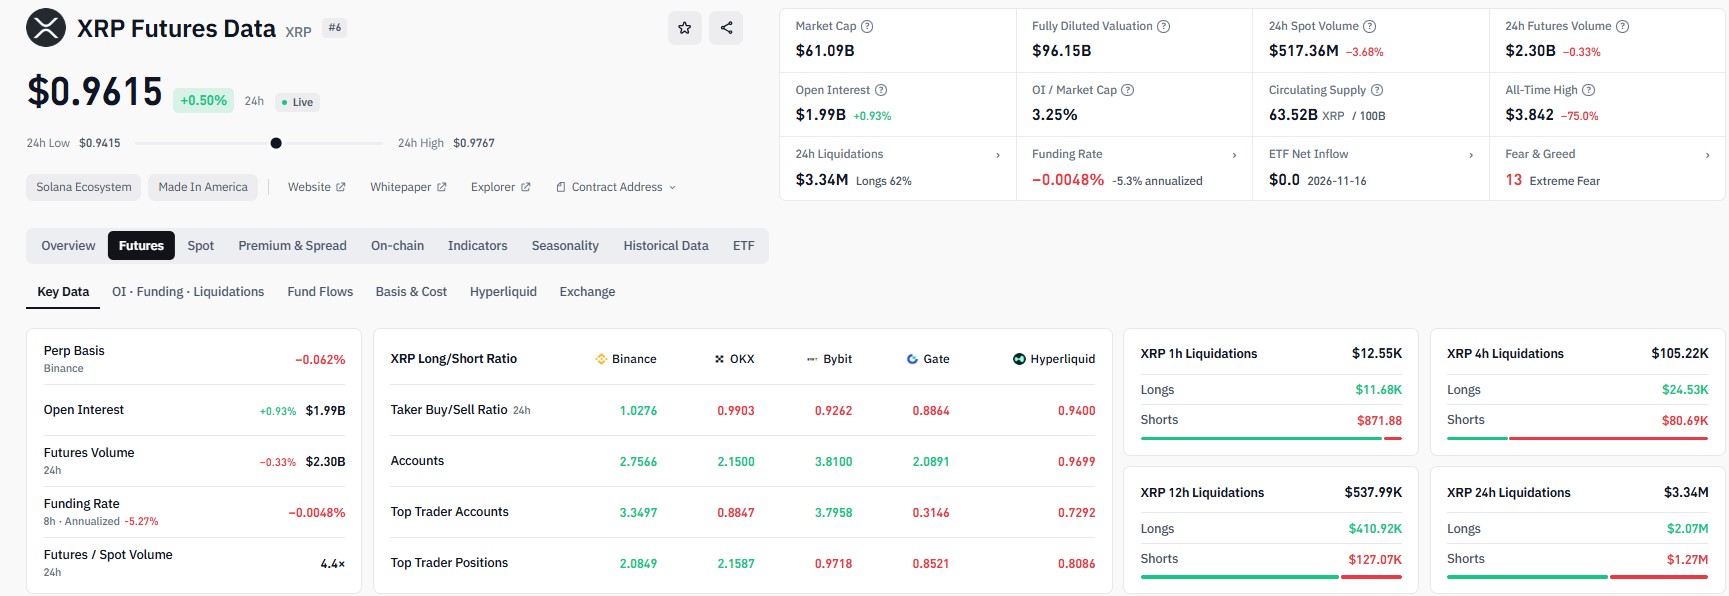
Key Price Levels to Watch
Level | Why it matters |
$0.9415 | 24-hour low, first area of short-term support |
$0.78 | Rising trendline and Martinez's expected floor |
$0.9767 | 24-hour high, near-term resistance |
$1.55 | October high |
$3.50 | Triangle resistance, needs a weekly close above it |
$3.842 | All-time high |
$18 | Long-term target if the triangle confirms |
What Could Happen Next
The bullish case is simple. A hold near $0.78 would keep the triangle alive and could set up a move toward $3.50.
The bearish case is just as clear. A break below that trendline would put the whole pattern in doubt.
For now, sentiment sits in extreme fear and derivatives traders are split. XRP may stay choppy until it picks a direction.
Nobody can say how it ends. The levels above simply show where traders are looking.
Disclaimer
This article is for information only and is not financial advice. Crypto prices are volatile, and you can lose money. Chart patterns and analyst targets are opinions, not guarantees. Do your own research and speak with a licensed financial adviser before you invest.