XRP Price Prediction October 2026: This Level Could Set the Next Range

The XRP price today is $1.4954, up 0.5% in the last 24 hours. Over the past seven days, though, the token is down about 9%.
Bulls now need to defend the $1.40 to $1.45 area. They also need to clear $1.58 to $1.60 to get back above $1.60.
Last week, the coin touched $1.6581. It has slipped since then. So the next move is either a fresh test of $1.60 or a slide toward $1.40.
What Is the Current Price and Market Cap Today?
Here is where the token stands right now, based on spot and derivatives data.
Metric | Value |
Current price | $1.4954 |
24-hour change | +0.5% |
7-day change | About -9% |
Market cap | About $94.28B |
Spot volume (24h) | $900.07M |
Futures volume (24h) | About $5.15B |
Open interest | About $3.48B |
Circulating supply | 63.09B |
Total supply | 99.98B |
Max supply | 100B |
Binance trading pair | About $1.52 (24h range $1.47 to $1.56) |
XRP Latest News: Are Spot ETFs Still Seeing Inflows?
As per SoSoValue, Spot ETFs tied to the token had five straight days of net inflows. From Sept. 22 to Sept. 28, they took in a combined $79.56M. Trading volume in that stretch was about $309.6M.
Then things went quiet. On Sept. 29, net flow was $0 and total value traded was $48.38M.
Cumulative net inflows moved from about $1.73B to $1.79B during the run. Inflows have been shrinking near the end, though. The last positive day was only $3.96M.
Total net assets sat near $1.69B on Sept. 29, below $1.77B on Sept. 25. Since flows stayed positive, the lower value probably reflects the softer price.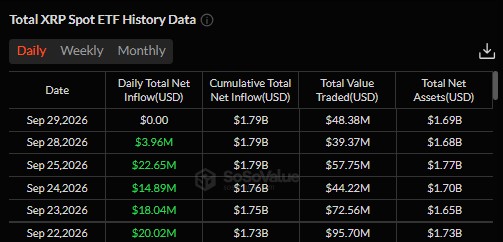
XRP News Today: Why Is the Price Down This Week?
The token is down about 9% over seven days. The data does not point to one clear cause, but a few things stand out.
As per CoinGlass data, Futures volume is about $5.15B, down 7.31%. Open interest is up 0.26%, so traders are not leaving in a hurry.
The 24-hour long/short ratio is 0.9505. That is close to even, with a tiny lean toward shorts overall.
Account-level data looks different. Binance shows a ratio of 2.5524, and OKX shows 2.78. Binance top traders sit at 2.7722 by accounts and 2.0956 by positions. More people are leaning long on those exchanges.
Options are quieter. Volume fell 45.84% to $4.17M, while options open interest rose 1% to $67.47M. Fewer trades, but existing positions mostly stayed put.
Period | Total liquidations | Longs | Shorts |
1 hour | $691.38 | $170.24 | $521.15 |
4 hours | $69.98K | $36.00K | $33.98K |
12 hours | $685.36K | $571.41K | $113.95K |
24 hours | $8.10M | $5.30M | $2.81M |
Longs took the bigger hit over 24 hours. Most of it happened earlier in the day, since the 12-hour total is far smaller than the 24-hour figure.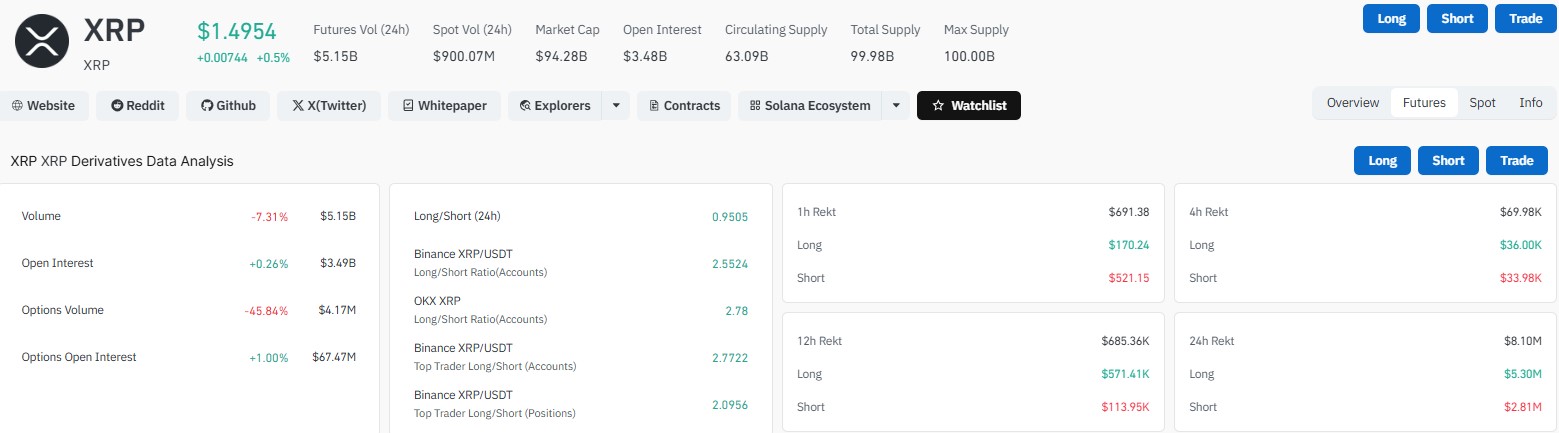
XRP Price Forecast: Key Support and Resistance Levels
On the weekly chart, the token has spent several weeks between roughly $1.35 and $1.60. Four moving averages are bunched inside that zone.
Weekly EMA | Approx. level |
20 EMA | $1.337 |
50 EMA | $1.521 |
100 EMA | $1.584 |
200 EMA | $1.373 |
Price is sitting right next to the 50 EMA. That is why the $1.45 to $1.60 zone is widely seen as a decision area.
Price level | What it means |
$1.00 to $1.05 | Major downside support, near the last big swing low |
$1.20 | Middle downside zone |
$1.30 to $1.37 | Support and compression floor |
$1.49 to $1.52 | Current decision area |
$1.55 to $1.60 | Key breakout resistance |
$1.65 to $1.70 | First upside zone |
$1.80 | Major resistance |
$2.00 | Round-number and structural target |
$2.20 to $2.40 | Larger upside zone |
What Is a Megaphone Pattern in Crypto?
A megaphone, or broadening pattern, forms when highs get higher and lows get lower. Swings get wider instead of tighter.
The weekly chart shows some of that here. At the same time, price is squeezed between the moving averages. Tight ranges often come before bigger moves.
But the pattern does not pick a direction. The breakout does.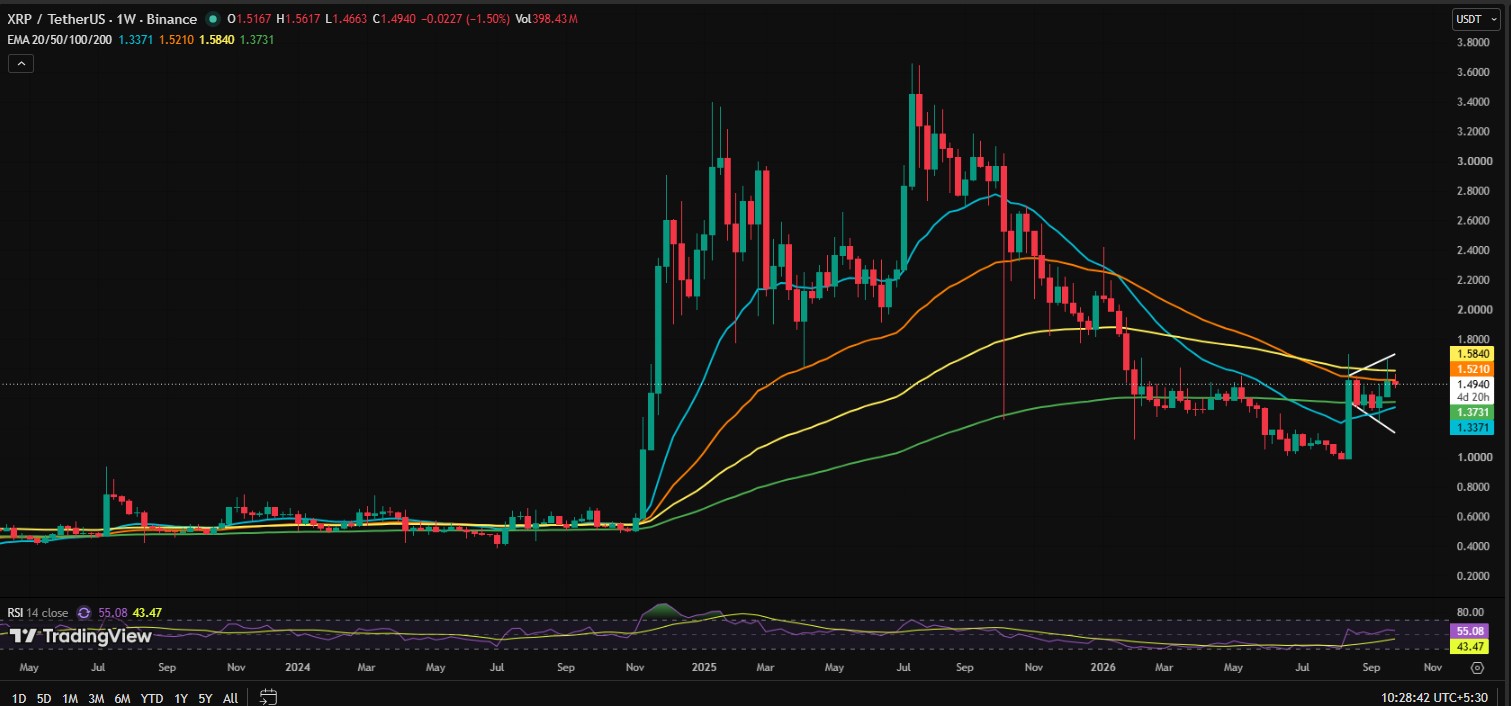
Will XRP Go Up? Bullish Scenario Above $1.60
The first thing to watch is a weekly close above $1.55 to $1.60. Rising volume would help the case.
If price breaks out and then holds that zone as support on a retest, the next stops could be:
$1.65, then $1.80, then $2.00, then $2.20 to $2.40.
A move above $1.80 would matter most. It would pull the price away from the current squeeze.
How Low Can XRP Go? Bearish Scenario Below $1.40
The bearish case starts if the token keeps failing at $1.55 to $1.60. After that, the $1.37 to $1.40 area becomes the test.
A clear weekly break under it could open the way to $1.30, $1.20, and then $1.05 to $1.10. That would mean the megaphone is resolving toward its lower edge.
Will the Price Rise or Fall Next? What to Watch
This price outlook comes down to two zones. Above, $1.55 to $1.60. Below, $1.37 to $1.40.
ETF flows are worth tracking too. Five days of inflows helped, but the flat session on Sept. 29 shows buying has cooled.
Nobody knows which way the break will go. A slow drift inside the range is possible as well.
Disclaimer
This article is for information only. It is not financial, investment, legal, or tax advice. Crypto prices are volatile, and you can lose money. Price levels and scenarios above are not guarantees. Do your own research and speak with a licensed financial advisor before making any decision.










.webp)











