Chainlink Price Prediction: Why Is LINK Rising After ETF Inflows Now?


Chainlink price prediction searches are rising, and LINK has traders watching the screen a little closer than usual. One level decides whether it pays off, and another decides whether the idea is dead.
The editorial desk holds no personal position in this coin. This is purely a chart and data read.
Quick answer: For the Chainlink price prediction, LINK trades at $14.240. A 1-hour close above $15.780 targets $21.500, while a 1-hour close below $13.160 opens $12.041.
Chainlink Price Today: Live Market Data and Open Interest Snapshot
The current market price (CMP) is $14.240. Market cap sits at $10.64B. Futures volume over 24h is $381.44M against spot volume of $78.09M. Open interest, the total value of futures contracts still open, stands at $733.31M. Circulating supply is 748.09M coins out of a 1.00B maximum.
Source: CoinGlass, Oct 5, 2026, 1:40 PM.
Chainlink News Today: Spot ETF Inflows and Their Price Impact
An unverified report from BSCN on X says spot Chainlink ETFs just had their best week since August, taking in +$8.3M over the past five trading days. The same post says spot LINK ETFs have logged only two single days of net outflows since launching last year. 
The visible text cuts off there, so only these points are used. $8.3M is small against a $10.64B market cap, about 0.08%, so it reads as steady interest, not a surge.
Source: BSCN on X, posted about 12h before Oct 5, 2026, 1:40 PM.
Key Takeaways: LINK Price Target and Breakout Levels at a Glance
CMP is $14.240 on the 1-hour Binance chart.
Price is trading inside an ascending channel.
A 1-hour close above $15.780 targets $21.500.
A 1-hour close below $13.160 opens $12.041.
Chainlink Technical Analysis: Ascending Channel on the 1-Hour Chart
Methodology: LINK/USDT, 1-hour timeframe, Binance, with RSI divergence as the indicator. The bullish case is invalid on a 1-hour close below $13.160.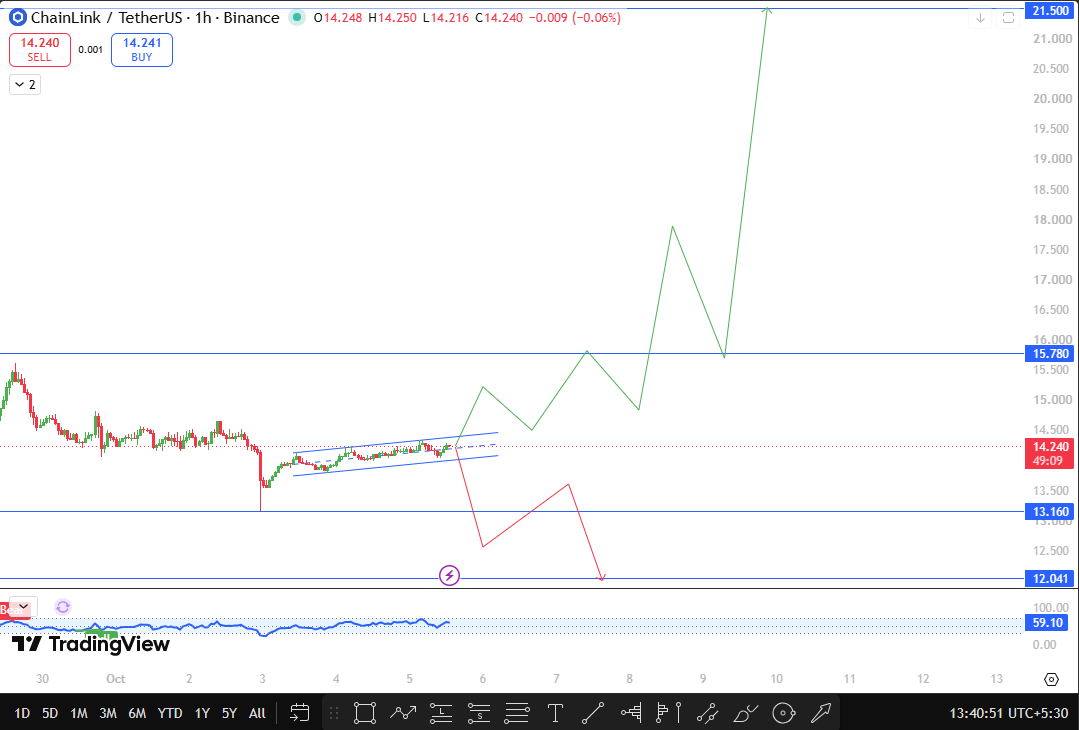
After the Oct 3 sell-off, whose low sat near $13.160, the price stabilized and began climbing in small steps inside a narrow ascending channel.
The slope is gentle, and the candles are small. At $14.240, the price sits in the upper half of the channel.
RSI divergence reads 59.10 and has stayed flat through the channel, which fits a slow, grinding climb, not a surge.
That is the main caution here. A narrow channel can break either way, so a break only counts on a confirmed close.
Chainlink Price Forecast: Support and Resistance Levels Ahead
Level | Type | Importance | Distance From CMP |
$21.500 | Resistance | Final upside target | +50.98% |
$15.780 | Resistance | Breakout trigger | +10.81% |
$14.240 | CMP | Current price | 0% |
$13.160 | Support | Breakdown trigger | -7.58% |
$12.041 | Support | Final downside target | -15.44% |
LINK Forecast: Bullish, Base, and Bearish Price Scenarios Explained
Bullish Scenario: 1-Hour Close Above $15.780 Opens $21.500
Price first has to clear the top of the channel, then confirm a close above $15.780. The LINK price target sits at $21.500. A retest that holds above $15.780 makes the move cleaner, while a close back under it weakens the breakout.
Base Scenario: Range Between $13.160 and $15.780 Inside the Channel
If neither level breaks on a close, the price keeps grinding inside the channel. A close below the channel floor would show buyers losing grip, though the bullish case stays alive above $13.160.
Bearish Scenario: 1-Hour Close Below $13.160 Opens $12.041
A close below $13.160 puts $12.041 in play and cancels the bullish read. That level is also where the Oct 3 sell-off found its floor, so losing it would be a clear shift. The move gains weight if the price loses the channel floor first and cannot reclaim it and loses weight if buyers defend $13.160 quickly.
Chainlink Trend Analysis: Open Interest, Volume, and Positioning
Futures volume of $381.44M is about 4.9 times spot volume of $78.09M, and open interest of $733.31M equals roughly 6.89% of the $10.64B market cap.
Leverage is present but modest against the size of the coin. Spot demand is the other piece: if the ETF report holds, steady buying sits underneath a quiet chart.
Risks to the LINK Price Prediction and Setup Invalidation Rules
The ETF report is unverified and cuts off mid-sentence, and $8.3M is small next to the market cap.
The channel is narrow, so a break in either direction can fail fast. About 251.91M coins, 25.19% of supply, still sit outside circulation. A close below $13.160 ends the bullish case.
LINK Technical Analysis: Final Conclusion and Next Price Move
Price is climbing inside its ascending channel from $14.240. Everything now hinges on $15.780 above and $13.160 below.
A 1H close above $15.780 puts $21.500 in play, while a close below $13.160 opens $12.041.
Disclaimer: Educational Chart Analysis, Not Financial Advice
Educational content only, not financial advice. Crypto markets are volatile, so do your own research before trading.








.webp)








