XRP Price Today: Whales Sell as Fed Meeting Puts $1.26 Support at Risk


XRP is trading at $1.2778 today, down 2.5% in 24 hours. The coin sits just above $1.26, a support level traders are watching closely.
The wider market looks shaky too. Bitcoin slipped below $80,000, and Ethereum fell under $2,300. The total crypto market cap is $2.66 trillion, down 1.47%.
The Fed meets on Wednesday, October 28. Analyst Ali Charts warns the coin could fall to $0.98 if whales keep selling.
XRP Price Today: How Much Is $XRP Trading At Right Now?
Here is a quick look at the numbers from derivatives data.
Metric | Value |
Price | $1.2778 |
24-hour change | -2.5% |
Market cap | $80.89 billion |
Futures volume (24h) | $2.09 billion |
Spot volume (24h) | $310.48 million |
Open interest | $2.82 billion (-2.89%) |
Circulating supply | 63.35 billion |
Max supply | 100 billion |
Futures volume is much bigger than spot volume. Most of the action is happening in derivatives.
Why Is XRP Going Down Today?
Part of the answer is the macro mood. Reports say US and Israeli strikes on Iran increasingly look like a matter of when, not if.
The US-Iran tension is pushing energy prices higher. That adds to inflation. CPI and PPI both came in hotter than expected, and core inflation is also rising.
The US economy looks weaker at the same time. Housing is struggling, borrowing costs are high, and companies are cutting jobs.
Rising prices and a slowing economy are what people call stagflation. Risk assets like crypto often struggle in that setup.
What Is the Fed Likely to Do on October 28?
Kevin Warsh heads into this FOMC meeting facing a tough spot. The Fed needs inflation to cool without hurting the economy more.
If the Fed... | What could happen |
Sounds too relaxed on inflation | Bond yields could rise on inflation fears |
Turns hawkish | Stocks and crypto could sell off on tighter conditions |
Signals rate cuts | Investors may ask why it is easing while inflation rises |
XRP News Today: Are Whales Selling?
Ali Charts, using Santiment data, points to a drop in large wallets. The number of wallets holding 10 million to 100 million $XRP fell from 351 to 339 over the past few weeks.
That is 12 fewer big wallets. It is a small number, but it hints that some large holders are trimming their exposure.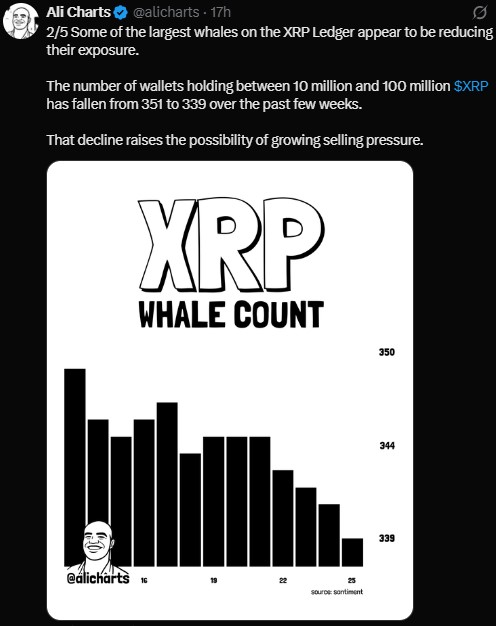
XRP Latest News: Are More Coins Moving to Exchanges?
The balance on exchanges rose from 11.003 billion to about 11.05 billion. It has stayed high for the past week.
That is roughly 50 million more tokens on trading platforms. More supply on exchanges can mean more selling, though not always. Some traders simply move coins there to trade.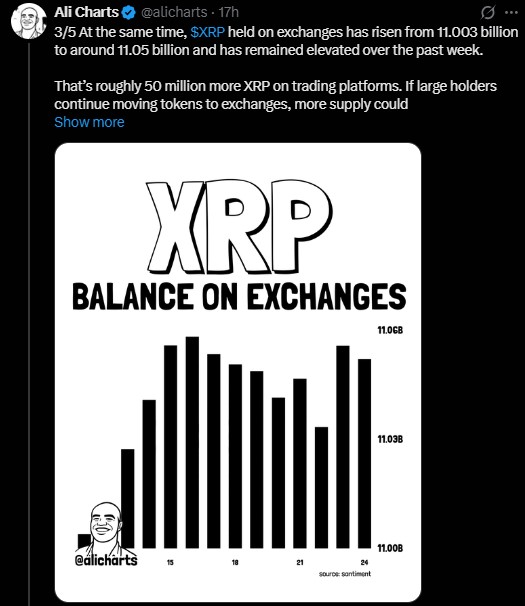
XRP News: Are Traders Long or Short?
Derivatives Metric | Reading |
Long/short ratio (24h) | 1.0678 |
Binance long/short (accounts) | 2.9984 |
OKX long/short (accounts) | 3.59 |
Binance top traders (accounts) | 3.6125 |
Binance top traders (positions) | 2.0765 |
Options volume | $3.20 million (+57.34%) |
Options open interest | $68.92 million (-0.54%) |
Longs outnumber shorts, so sentiment leans bullish. Open interest fell 2.89% to $2.82 billion, so there are fewer open contracts than a day ago.
Still, longs took most of the pain. Here is how liquidations looked across different windows.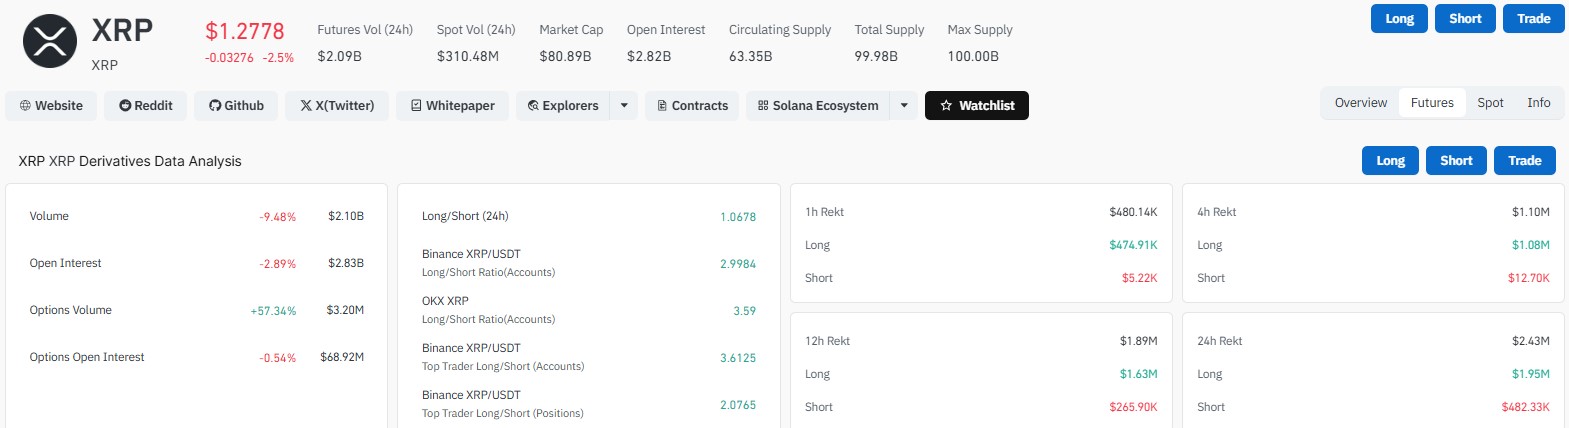
Window | Total | Longs | Shorts |
1 hour | $480.14K | $474.91K | $5.22K |
4 hours | $1.10M | $1.08M | $12.70K |
12 hours | $1.89M | $1.63M | $265.90K |
24 hours | $2.43M | $1.95M | $482.33K |
About 80% of the 24-hour total came from long positions.
XRP Price Forecast: What Are the Key Support and Resistance Levels?
On the 4-hour chart, the coin trades near $1.30. Ali Charts says $1.26 is the lower edge of a channel forming since August.
Level | Type | Note |
$1.62 | Resistance | Marked on the 4-hour chart |
$1.52 | Resistance | Marked on the 4-hour chart |
$1.43 | Resistance | Marked on the 4-hour chart |
$1.34 | Resistance | Marked on the 4-hour chart |
$1.30 | Current area | Price tag on the 4-hour chart |
$1.26 | Support | Lower channel line since August |
$1.11 | Support | First target if $1.26 breaks |
$0.98 | Support | Channel target, about 22% below $1.26 |
The 4-hour chart marks $1.26 with an arrow, which is why the XRP price is getting so much attention there.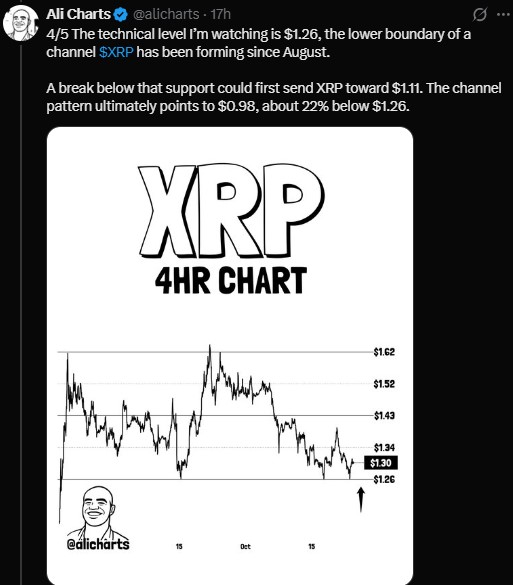
XRP Price Prediction: Can XRP Fall to $0.98?
The bearish case rests on three things. Fewer large wallets, higher exchange balances, and a break below $1.26.
If $1.26 fails, $1.11 comes first. That sits about 12% lower. The channel pattern then points to $0.98.
If $1.26 holds, the price could stay stuck between $1.26 and $1.34 for a while. None of this is certain.
Will XRP Recover?
That depends on a few things. The Fed tone, the whale count, and exchange balances all matter.
A move back toward $1.43 or higher would need stronger buying. Right now, the chart shows a range, with $1.62 as the top and $1.26 as the floor.
If XRP slips under the floor, the story changes fast. If it holds, sellers may lose some steam. Both paths are open.
Ripple Price Prediction: Will the Fed Meeting Move the Market?
CME FedWatch shows a 90.6% chance the Fed holds rates at 3.75% to 4.00% on October 28. A 25-basis-point hike to 4.00% to 4.25% has a 9.4% chance.
Timeframe | Hold (3.75%-4.00%) | Hike (4.00%-4.25%) |
Now | 90.6% | 9.4% |
1 day ago (Oct 23) | 90.0% | 10.0% |
1 week ago (Oct 16) | 84.5% | 15.5% |
1 month ago (Sep 25) | 35.8% | 64.2% |
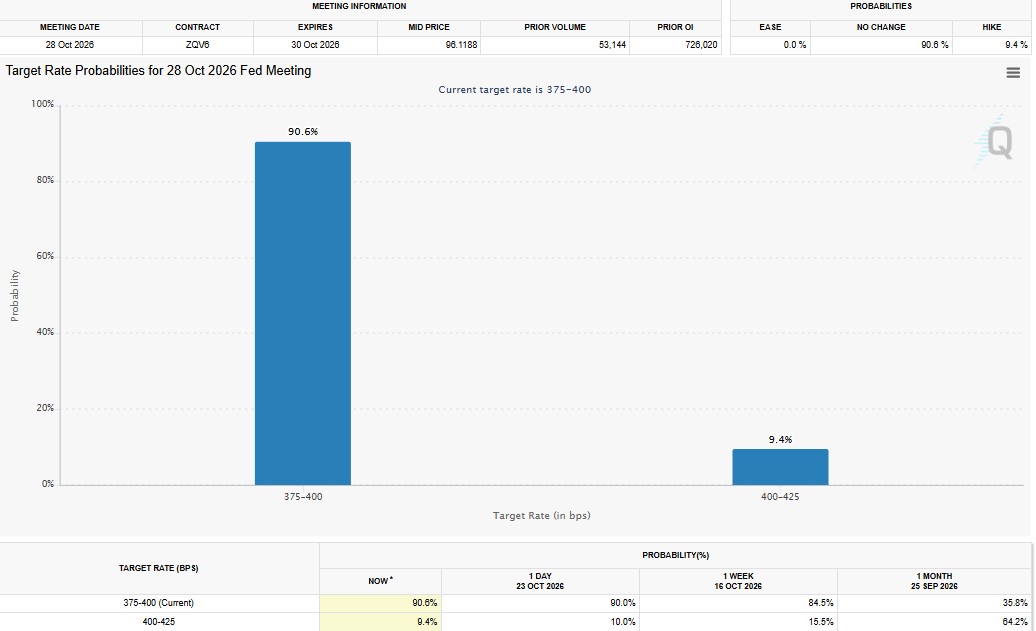
Markets clearly expect no change. So the words around the decision may matter more than the decision itself. Any Ripple price prediction has to leave room for a sharp move either way.
A single hawkish comment could weigh on stocks. A dovish surprise could lift worries about inflation and send bond yields higher. Both could move the dollar and risk assets like XRP.
Disclaimer
This article is for information only and is not financial, investment, or trading advice. Crypto assets are volatile, and you can lose some or all of your money. Price levels and forecasts are not guaranteed. Always do your own research and speak with a licensed financial advisor before making any decision.

















