Zcash Price Prediction: From $250 Crash to $1,300! What’s Next for ZEC


Four months ago, a bug scare sent Zcash down to nearly $250. Today ZEC trades near $1,331, about 5 times higher. Anyone who sold in the panic missed the run.
The Zcash price today is trading around 1,330 and up 2%, which has pushed it out of a falling channel, so what comes next? This Zcash price prediction covers the story, the liquidation data, and the levels to watch.
ZEC Liquidation Data: Shorts Took 70% of 24h Losses
Liquidation means a leveraged futures position is closed by force when the trader's margin runs out. Short positions bet on a fall, and they get liquidated when the price rises.
Futures liquidation data from Coinglass. Spot volume is tracked separately.
Timeframe | Total Liquidated | Long | Short |
1h | $431.20K | $431.18K | $20.07 |
4h | $594.27K | $531.93K | $62.34K |
12h | $2.22M | $662.85K | $1.55M |
24h | $3.48M | $1.04M | $2.44M |
Over 24 hours, Shorts lost $2.44M of the $3.48M total. That fits the climb out of the channel. In the last hour, though, almost all of the $431.20K came from longs, which points to a quick dip after the push.
Zcash News: Post Says the Bug Crashed Was the Biggest Test
A post on X looks back at a bug disclosure from four months ago. It says the bug could have let someone create undetectable fake ZEC inside the Orchard shielded pool. A shielded pool holds coins in private form, so transfers hide the amounts and addresses.
According to the post, ZEC crashed from around $630 to nearly $250 on the news, and it now trades around $1,330.
The post argues that when a problem gets fixed and the main thesis stays strong, the worst headline can turn into the biggest test of conviction.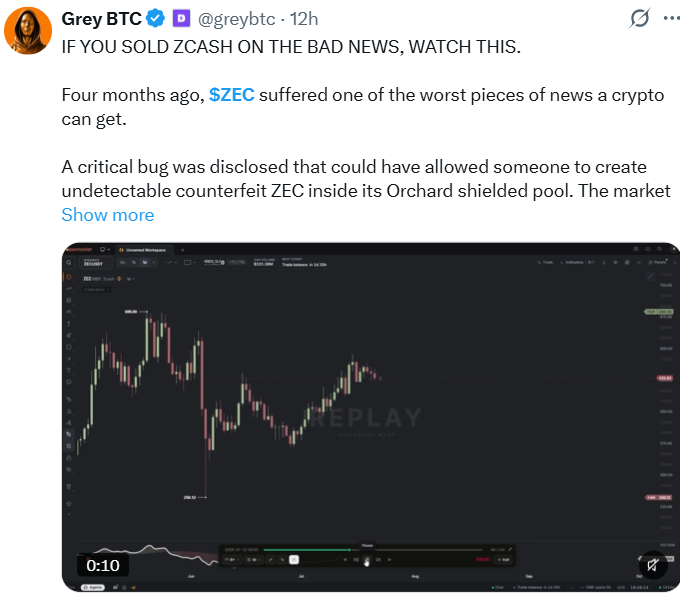
Source: Data From X
CoinGabbar could not independently verify the bug details or the price figures in the post.
Zcash Technical Analysis
ZEC peaked near $1,700 on September 27, then fell inside a falling channel. Price touched the 200 EMA at 1,278.34 in early October and bounced.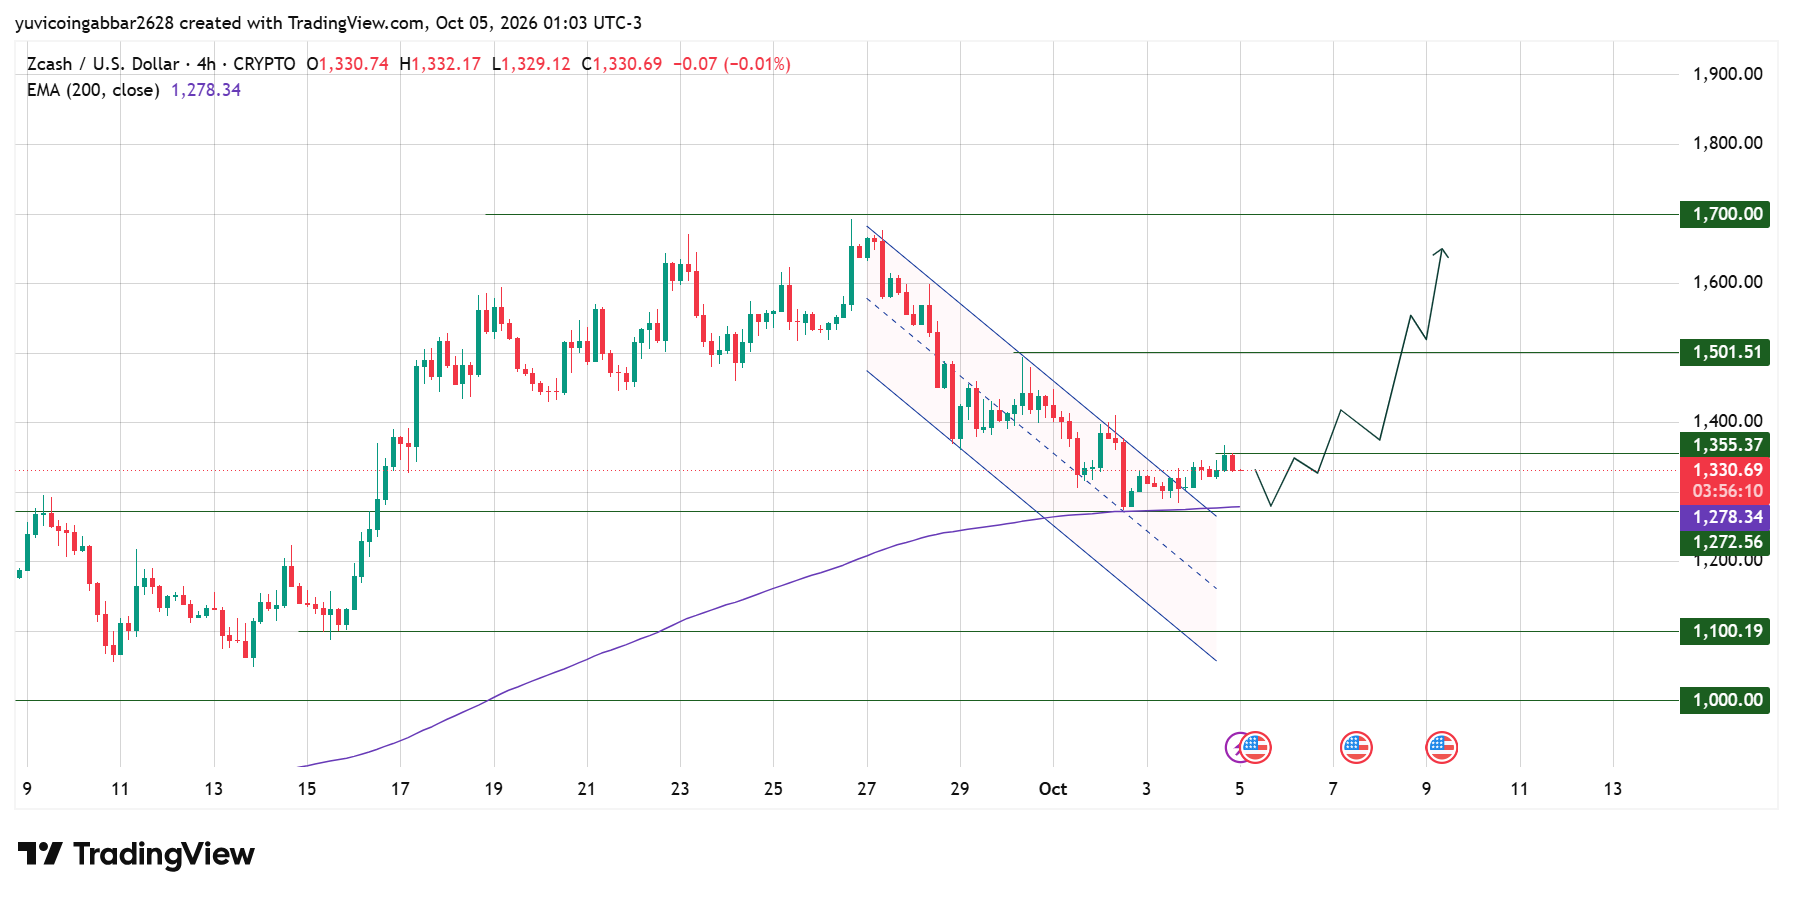
The latest candles have moved above the channel's upper line. The Zacsh price is at $1,330.69, just under the $1,355.37 resistance level that the last candle's wick reached. The 200 EMA at $1,278.34 is still rising. The breakout is confirmed.
Zcash Forecast: Support and Resistance Levels
Level Type | Price |
Resistance 3 | $1,700.00 |
Resistance 2 | $1,501.51 |
Resistance 1 | $1,355.37 |
$1,330.69 | |
First Confirmed Support | $1,278.34 and $1,272.56 |
Deeper Support | $1,100.19 |
Major Support | $1,000.00 |
Zcash Outlook
Bull case: A 4H close above $1,355.37 would confirm the breakout and point toward $1,501.51. Clearing that level opens the way back to $1,700.
Bear case: If ZEC falls back into the channel and closes below $1,272.56, the bounce off the 200 EMA would fail. The chart then points toward $1,100.19.
Zcash Price Prediction: Can ZEC Reach $1,700 Again?
The $1,700 level is the highest resistance line on the chart. ZEC would first need to close above $1,355.37, then clear $1,501.51. Each level has to hold on close, and the chart's arrow path shows pullbacks along the way. The post's bullish story does not set a target, so only the chart levels apply here.
Zcash Price Prediction 2026: Expert View
According to CoinGabbar analysts, momentum has shifted since ZEC bounced off the 200 EMA and left the channel. The next 4H close near $1,355.37 will show whether buyers can hold the move. Short liquidations already helped the climb, so a stall there could bring a quick pullback.
Disclaimer
This piece is for informational purposes only and isn't financial advice. The levels and scenarios above are based on technical chart analysis and publicly available data at the time of writing. Crypto markets can move sharply within hours, so past patterns don't guarantee future outcomes. Do your own research and consider your risk tolerance before acting on any level discussed here.








.webp)








