Zcash Price Prediction: Arthur Hayes Moves $5M USDC, Is ZEC Next?

Zcash trades at $866.11 after a 5% drop, while an onchain account asks whether Arthur Hayes is about to buy the dip.
This Zcash Price Prediction checks that claim against the daily chart, liquidation data and EMA levels. A daily close above $1,000 would be the first clear sign of recovery.
Market data checked on November 20, 2026, at 09:26 IST.
Why is ZEC’s price down today?
Zcash is down 5% to $866.11 in 24h, falling more sharply than Bitcoin and the broader market, primarily driven by broad crypto weakness amid Fed rate concerns and ETF outflows. ZEC’s decline is larger than the market move, so market beta is part of the explanation but may not account for all of it.
Primary reason: Broad market pressure, as tighter rate expectations and Bitcoin ETF outflows weighed on crypto prices.
Secondary reasons: Weak chart momentum confirms selling pressure; no clear ZEC-specific cause for the extra decline is established.
ZEC Liquidation Data: Longs Took Most of the Losses
A liquidation is a forced close of a leveraged trade when the trader can no longer cover losses. Longs bet on a rise, and shorts bet on a fall.
Window | Total Liquidated | Long | Short |
1h | $124.88K | $67.19K | $57.69K |
4h | $3.18M | $2.98M | $201.01K |
12h | $7.13M | $6.63M | $507.09K |
24h | $9.47M | $7.79M | $1.68M |
Source: Data From CoinGlass
Longs took about 94% of the 4-hour total, 93% of the 12-hour total and 82% of the 24-hour total. That fits a sharp fall that forced out leveraged buyers.
Zcash News: Does a USDC Transfer Mean Buying?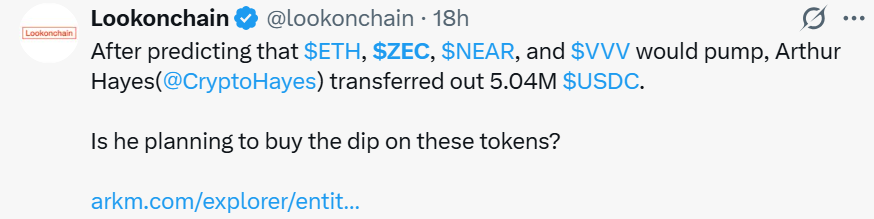
Lookonchain posted on X about 17 hours before publication that, after predicting that ETH, ZEC, NEAR and VVV would pump, Arthur Hayes transferred out 5.04M USDC.
It asked whether he plans to buy the dip on these tokens.
USDC is a dollar-pegged stablecoin. A transfer shows money moving, not what it will buy.
The post names no destination, and CoinGabbar could not verify it or the linked wallet page. Treat the question as speculation, not a signal.
Zcash Privacy Coin Fundamentals: Grayscale's 10-Year Recap
Grayscale posted about 6 hours before publication a talk with its Head of Research, @LowBeta, and Zcash founder @zooko. It lists these takeaways:
Zcash pioneered combining blockchain cryptography with zero-knowledge proofs, which let a party prove something is true without revealing the data.
Like Bitcoin, it has a 21M supply cap and proof-of-work.
Unlike Bitcoin, it is built to keep evolving, with coin-holder voting, fee burns and quantum readiness.
Source: Data From X
These are Grayscale's claims about long-term features. They do not explain today's price move.
Zcash Price Prediction: Technical Analysis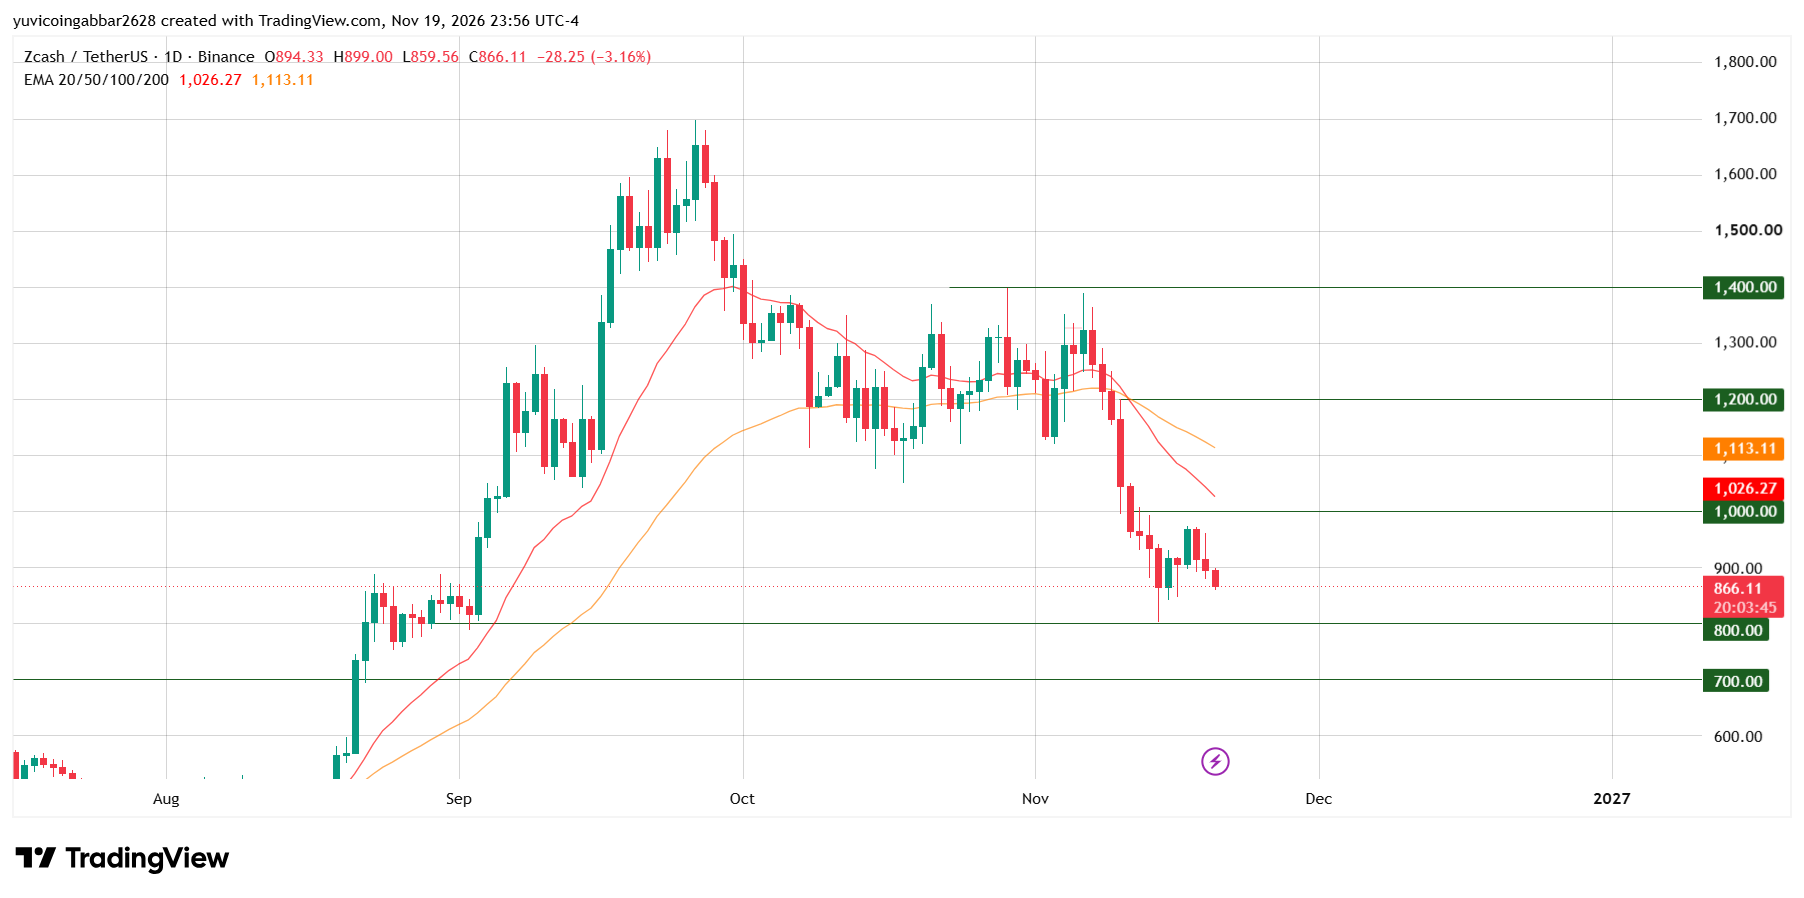
ZEC peaked near $1,700 in late September and then traded between about $1,100 and $1,400.
A steep November fall passed $1,200 and $1,000 and reached a low near $800 around November 14. A bounce was rejected just under $1,000, and today's red candle sits at $866.11.
EMA, or exponential moving average, averages recent closes and weights newer days more. The price is below both, and EMA 20 at $1,026.27 is under EMA 50 at $1,113.11.
Zcash Price Prediction: ZEC Support and Resistance Levels
Type | Level |
Highest marked level | $1,400.00 |
Upper resistance | $1,200.00 |
Key resistance | $1,000.00 |
Immediate price reference | $866.11 |
First confirmed support | $800.00 |
Deeper support | $700.00 |
Zcash Price Prediction Scenarios (November 20, 2026)
Bull scenario: For this ZEC price prediction, a daily close above $1,000 would point to a move toward $1,200. The setup fails if $ZEC closes back below $1,000.
Base scenario: If $ZEC stays between $800 and $1,000, the price would likely move sideways. A close beyond either level ends the range.
Bear scenario: A daily close below $800 would open a slide toward $700. The setup fails if $ZEC closes back above $800.
Zcash Price Prediction: Will $ZEC Recover to $1,400?
The highest marked level, $1,400, is about 62% above $866.11. Any Zcash Price Forecast toward it needs $ZEC to clear $1,000, EMA 50 and $1,200 first. See our $ZEC price history.
Zcash Price Prediction: CoinGabbar Technical Read (November 20, 2026)
The trend is down, and neither post has changed it. Only a close above $1,000 would show recovery, while a close below $800 would keep sellers in control. See our latest crypto price predictions.
Disclaimer
This article is for informational purposes only and isn't financial advice. Crypto markets are volatile. Always do your own research before making any trading decisions involving ZEC.