Zcash Price Prediction: Is ZEC's Reversal Real? $1,120 Is the Test!

Is ZEC's reversal real? ZEC trades at $949.20 after bouncing from $800, and one trader eyes $1,120 and $2,500.
In this Zcash Price Prediction, the price still sits below key averages, so the bounce is unconfirmed. A close above $1,000.00 would be the first sign of strength.
Market data checked on November 18, 2026, at 09:31 IST.
Why is ZEC price up today?
Zcash is today up 3% to $949.20 in 24h, outperforming a nearly flat crypto market and falling Bitcoin; the move appears driven mainly by ZEC specific buying and bullish attention, though the data cannot prove a single cause.
Reason: Reported treasury buying and bullish public commentary may have supported demand.
ZEC Liquidation Data: Shorts Take 74%
A liquidation is a forced close of a leveraged trade when a trader cannot cover losses. Longs bet on a rise, and shorts bet on a fall. Coinglass shows:
Window | Total Liquidated | Long | Short |
1h | $4.26K | $3.22K | $1.04K |
4h | $327.70K | $266.09K | $61.61K |
12h | $3.94M | $764.17K | $3.18M |
24h | $11.11M | $2.90M | $8.21M |
Shorts took about 74% of the $11.11M liquidated over 24 hours and about 81% of the last 12 hours, which fits a rally that squeezed shorts. In the last 4 hours, longs took about 81% of a much smaller $327.70K.
Zcash News Today: Trader Sees a Strong Bullish Reversal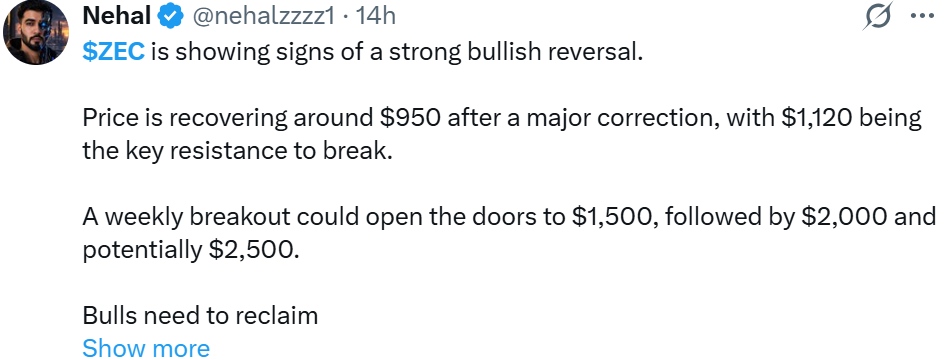
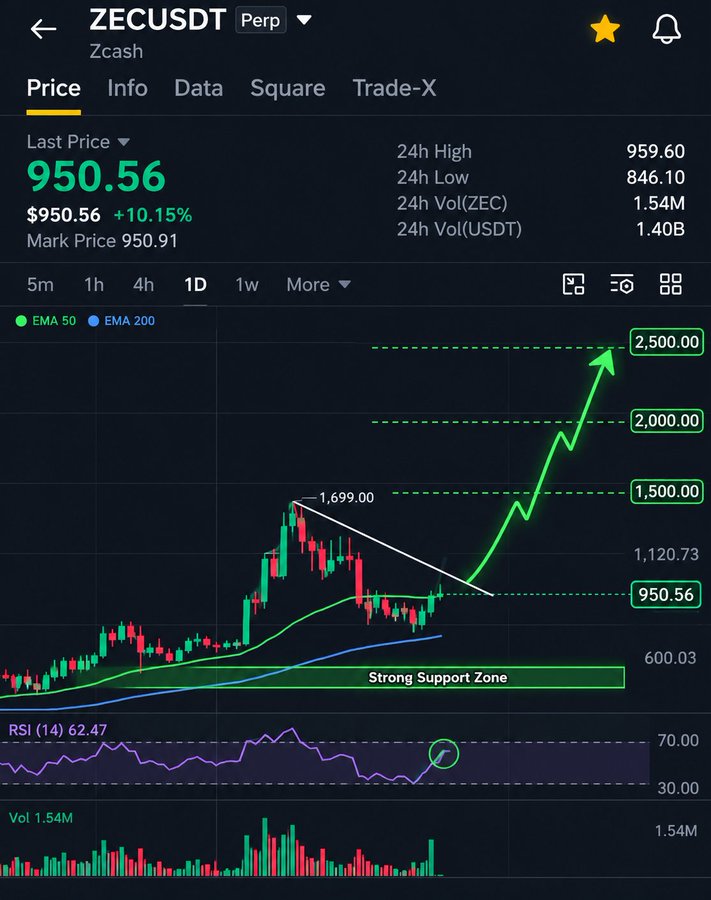
Nehal posted about 14 hours before publication: "$ZEC is showing signs of a strong bullish reversal. The price is recovering around $950 after a major correction, with $1,120 being the key resistance to break.
A weekly breakout could open the doors to $1,500, followed by $2,000 and potentially $2,500. Bulls need to reclaim resistance. I'm watching this setup closely."
Source: Data From X
Zcash Price Outlook: Grayscale Lists $ZEC for In-Kind Investing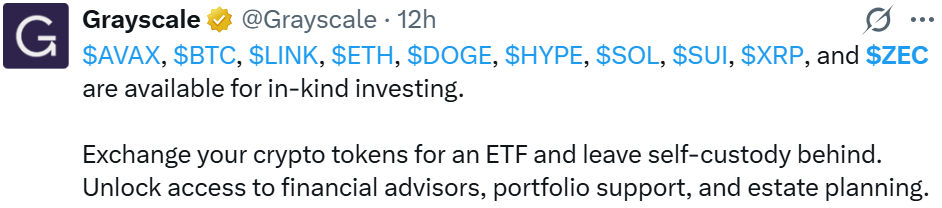
Grayscale posted on X about 12 hours before publication that ZEC and nine other tokens, including BTC and ETH, are available for in-kind investing.
It says holders can swap tokens for an ETF, leave self-custody behind and gain access to financial advisors and estate planning.
Zcash Price Prediction 2026: Technical Analysis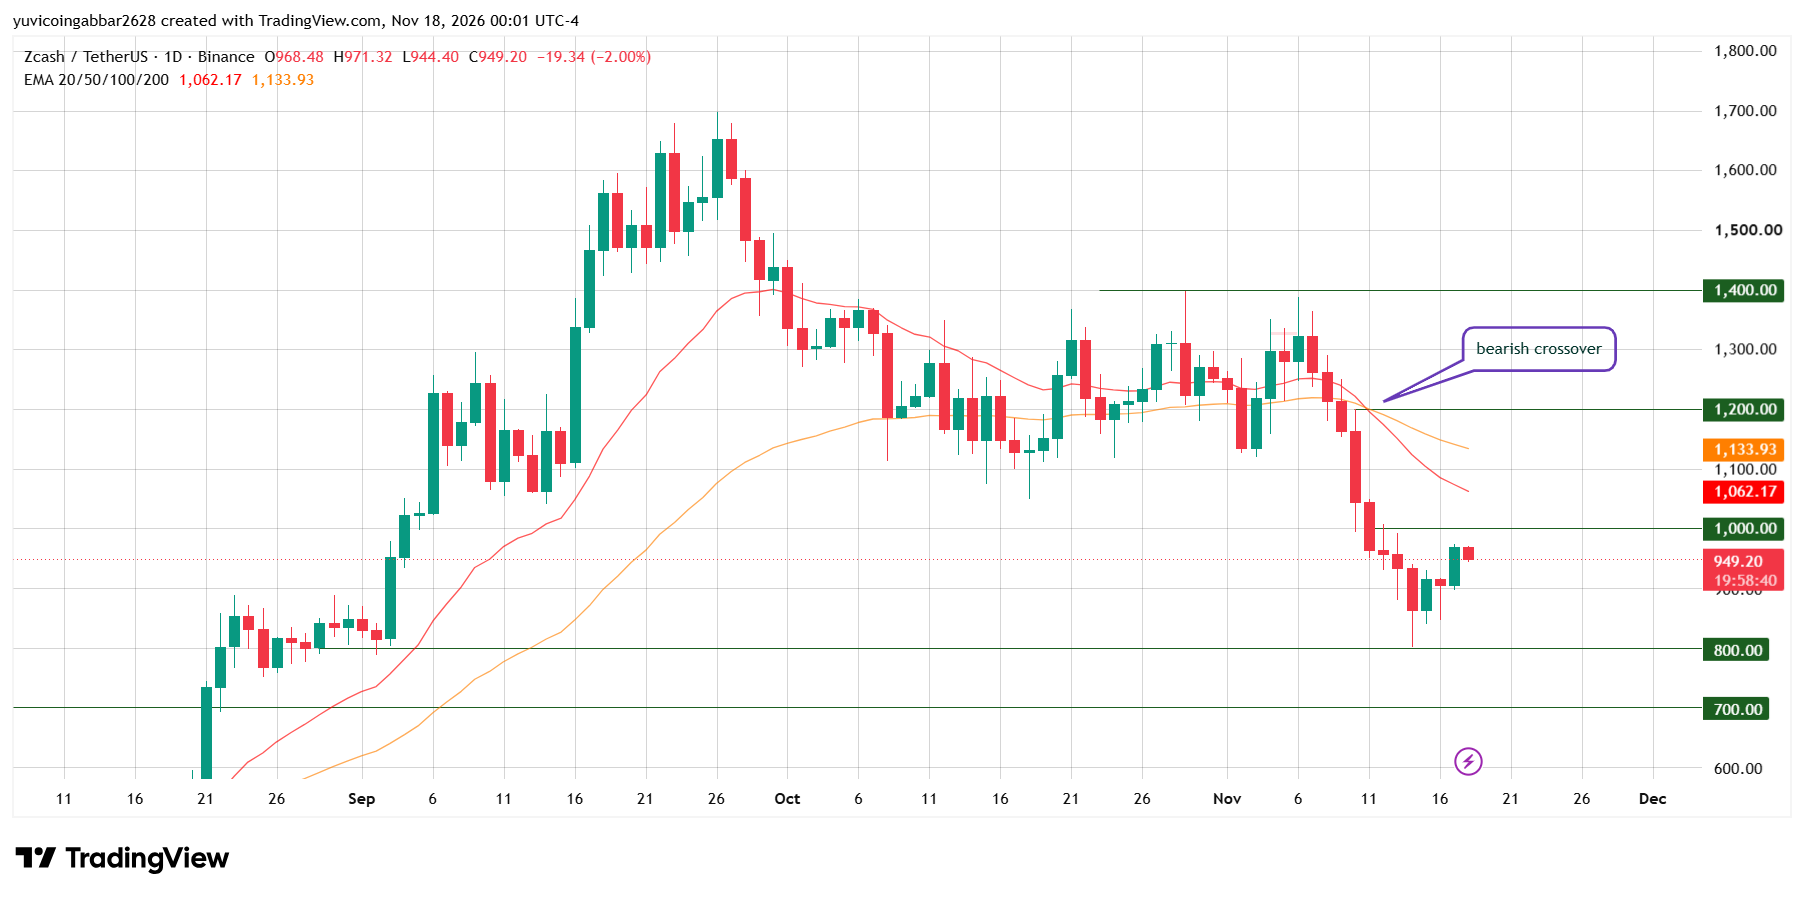
ZEC peaked near $1,700 in late September, then moved sideways below $1,400.00. After the bearish crossover, red candles pushed the price through $1,200.00 and $1,000.00 to $800.00, where buyers stepped in on November 14.
Today's candle opened at $968.48 and trading at $949.20, a pullback inside the bounce. It is still open.
EMA, or exponential moving average, averages recent closes and weights newer days more. The chart labels a bearish crossover, with EMA 20 at $1,062.17 under EMA 50 at $1,133.93, and the price sits below both.
Zcash Forecast: $ZEC Support and Resistance Levels
Type | Level |
Resistance zone | $1,400.00 |
Resistance zone | $1,200.00 |
Initial recovery level | $1,000.00 |
Immediate price reference | $949.20 |
First confirmed support | $800.00 |
Deeper support | $700.00 |
Zcash Price Prediction Scenarios (November 18, 2026)
Bull scenario: For this Zcash prediction, a daily close above $1,000.00 would point to a move toward $1,200.00. The setup fails if ZEC closes back below $1,000.00.
Base scenario: If $ZEC stays between $800.00 and $1,000.00, the price would likely move sideways. A break of either level ends the range.
Bear scenario: A daily close below $800.00 would open a slide toward $700.00. The setup fails if $ZEC closes back above $800.00.
Zcash Price Prediction: Can Zcash Reach $1,400?
It would take a gain of about 47% from $949.20. Any Zcash price forecast toward $1,400 needs ZEC to clear $1,000.00 and $1,200.00 first. See our $ZEC price history.
Zcash Price Prediction: CoinGabbar Technical Read
The bounce is real on the chart, but the trend is not yet reversed. Only a close above $1,000.00 would confirm a recovery, while a close below $800.00 would keep sellers in control. See our latest crypto price predictions.
Disclaimer
This article is for informational purposes only and isn't financial advice. Crypto markets are volatile. Always do your own research before making any trading decisions involving ZEC.