Avalanche Price Prediction After 8.0% Jump on NYSE News


Did one headline just change the AVAX trend, or will sellers cap the rally at $9.022 again?
$AVAX trading at $8.51 as of Nov 10, 2026, 06:54 UTC. That's 8.0% higher over 24 hours, after Avalanche's official X account announced a NYSE-linked platform plan. This Avalanche price prediction builds on the November AVAX coverage.
AVAX 24-Hour Market Snapshot
CoinGecko market data, captured 06:54 UTC on Nov 10, 2026, ranks Avalanche 26 by market cap.
Metric | Value |
Price | $8.51 |
24h change | +8.0% |
Market cap | $3.794B |
FDV | $4.007B |
24h volume | $551.522M |
Circulating supply | 445.845M AVAX |
Total supply | 470.847M AVAX |
Max supply | 720M AVAX |
Source: CoinGecko, AVAX market snapshot, captured Nov 10, 2026, 06:54 UTC
AVAX NYSE News and Catalyst
Tokenized securities are traditional shares recorded as tokens on a blockchain. Clearing and settlement is the step that confirms a trade and moves the cash and the asset. Per the official Avalanche X post, the planned NYSE-affiliated platform's core clearing and settlement layer will be built on Avalanche technology.
Source: Avalanche official X account (@avax), captured Nov 10, 2026, 06:54 UTC
The same post says Avalanche will support the platform's clearing firm and 24/7 trading, clearing, and settlement infrastructure.
If the platform goes live on Avalanche technology, the post becomes a working use case. If it slips, the 8.0% gain loses its catalyst.
AVAX ETF Flows From SoSoValue
SoSoValue ETF data as of Nov 9, 2026, UTC, shows $0.00 in daily net flow for spot $AVAX funds. Cumulative net inflow stands at $30.36M, and total net assets are $47.33M.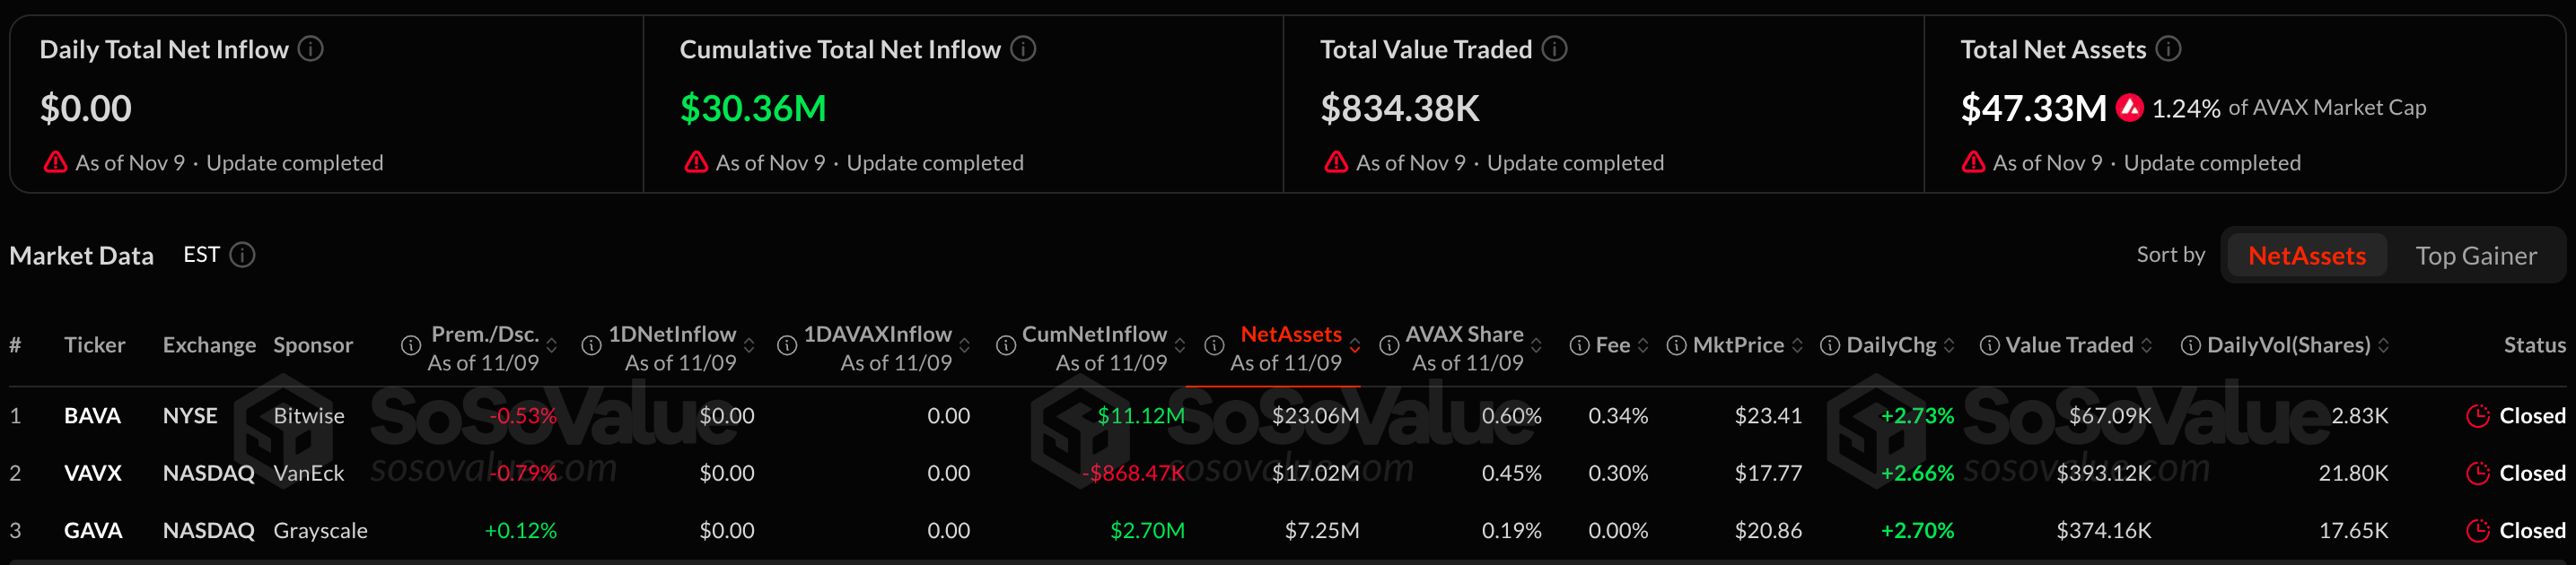
Source: SoSoValue, spot $AVAX ETF data as of Nov 9, 2026, UTC, captured Nov 10, 2026, 06:54 UTC
Bitwise's BAVA with $23.06M in net assets and $11.12M in cumulative inflow. VanEck's VAVX holds $17.02M, with a cumulative net outflow of $868.47K.
Method: figures come from the SoSoValue fund table. Flat daily flow means funds added no new demand on Nov 9, a detail worth reading alongside the latest crypto market news.
AVAX Liquidation Data Shows Longs Hit
Liquidation means an exchange forcibly ends a leveraged trade when losses exceed margin. Coinglass liquidation data at 06:54 UTC on Nov 10, 2026, shows $1.18M liquidated over 24 hours.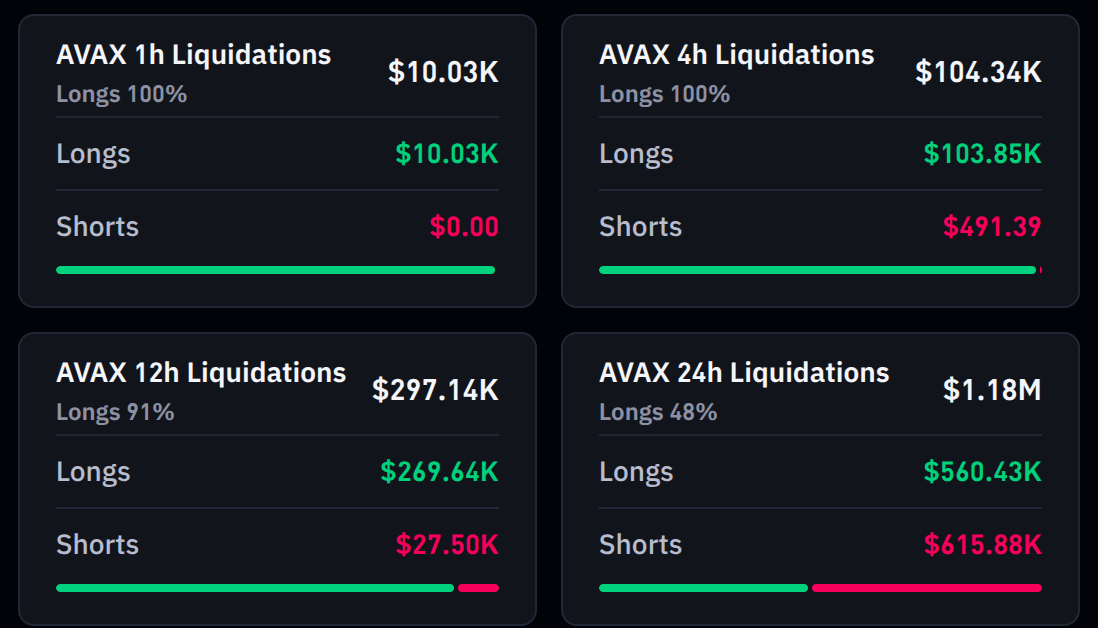
Source: CoinGlass, $AVAX liquidations, captured November 10, 2026, 06:54 UTC
Shorts lost $615.88K. Longs lost $560.43K. Over the last 12 hours, longs took the losses, at $269.64K against $27.50K for shorts.
AVAX Technical Analysis: 50-Day EMA and RSI Levels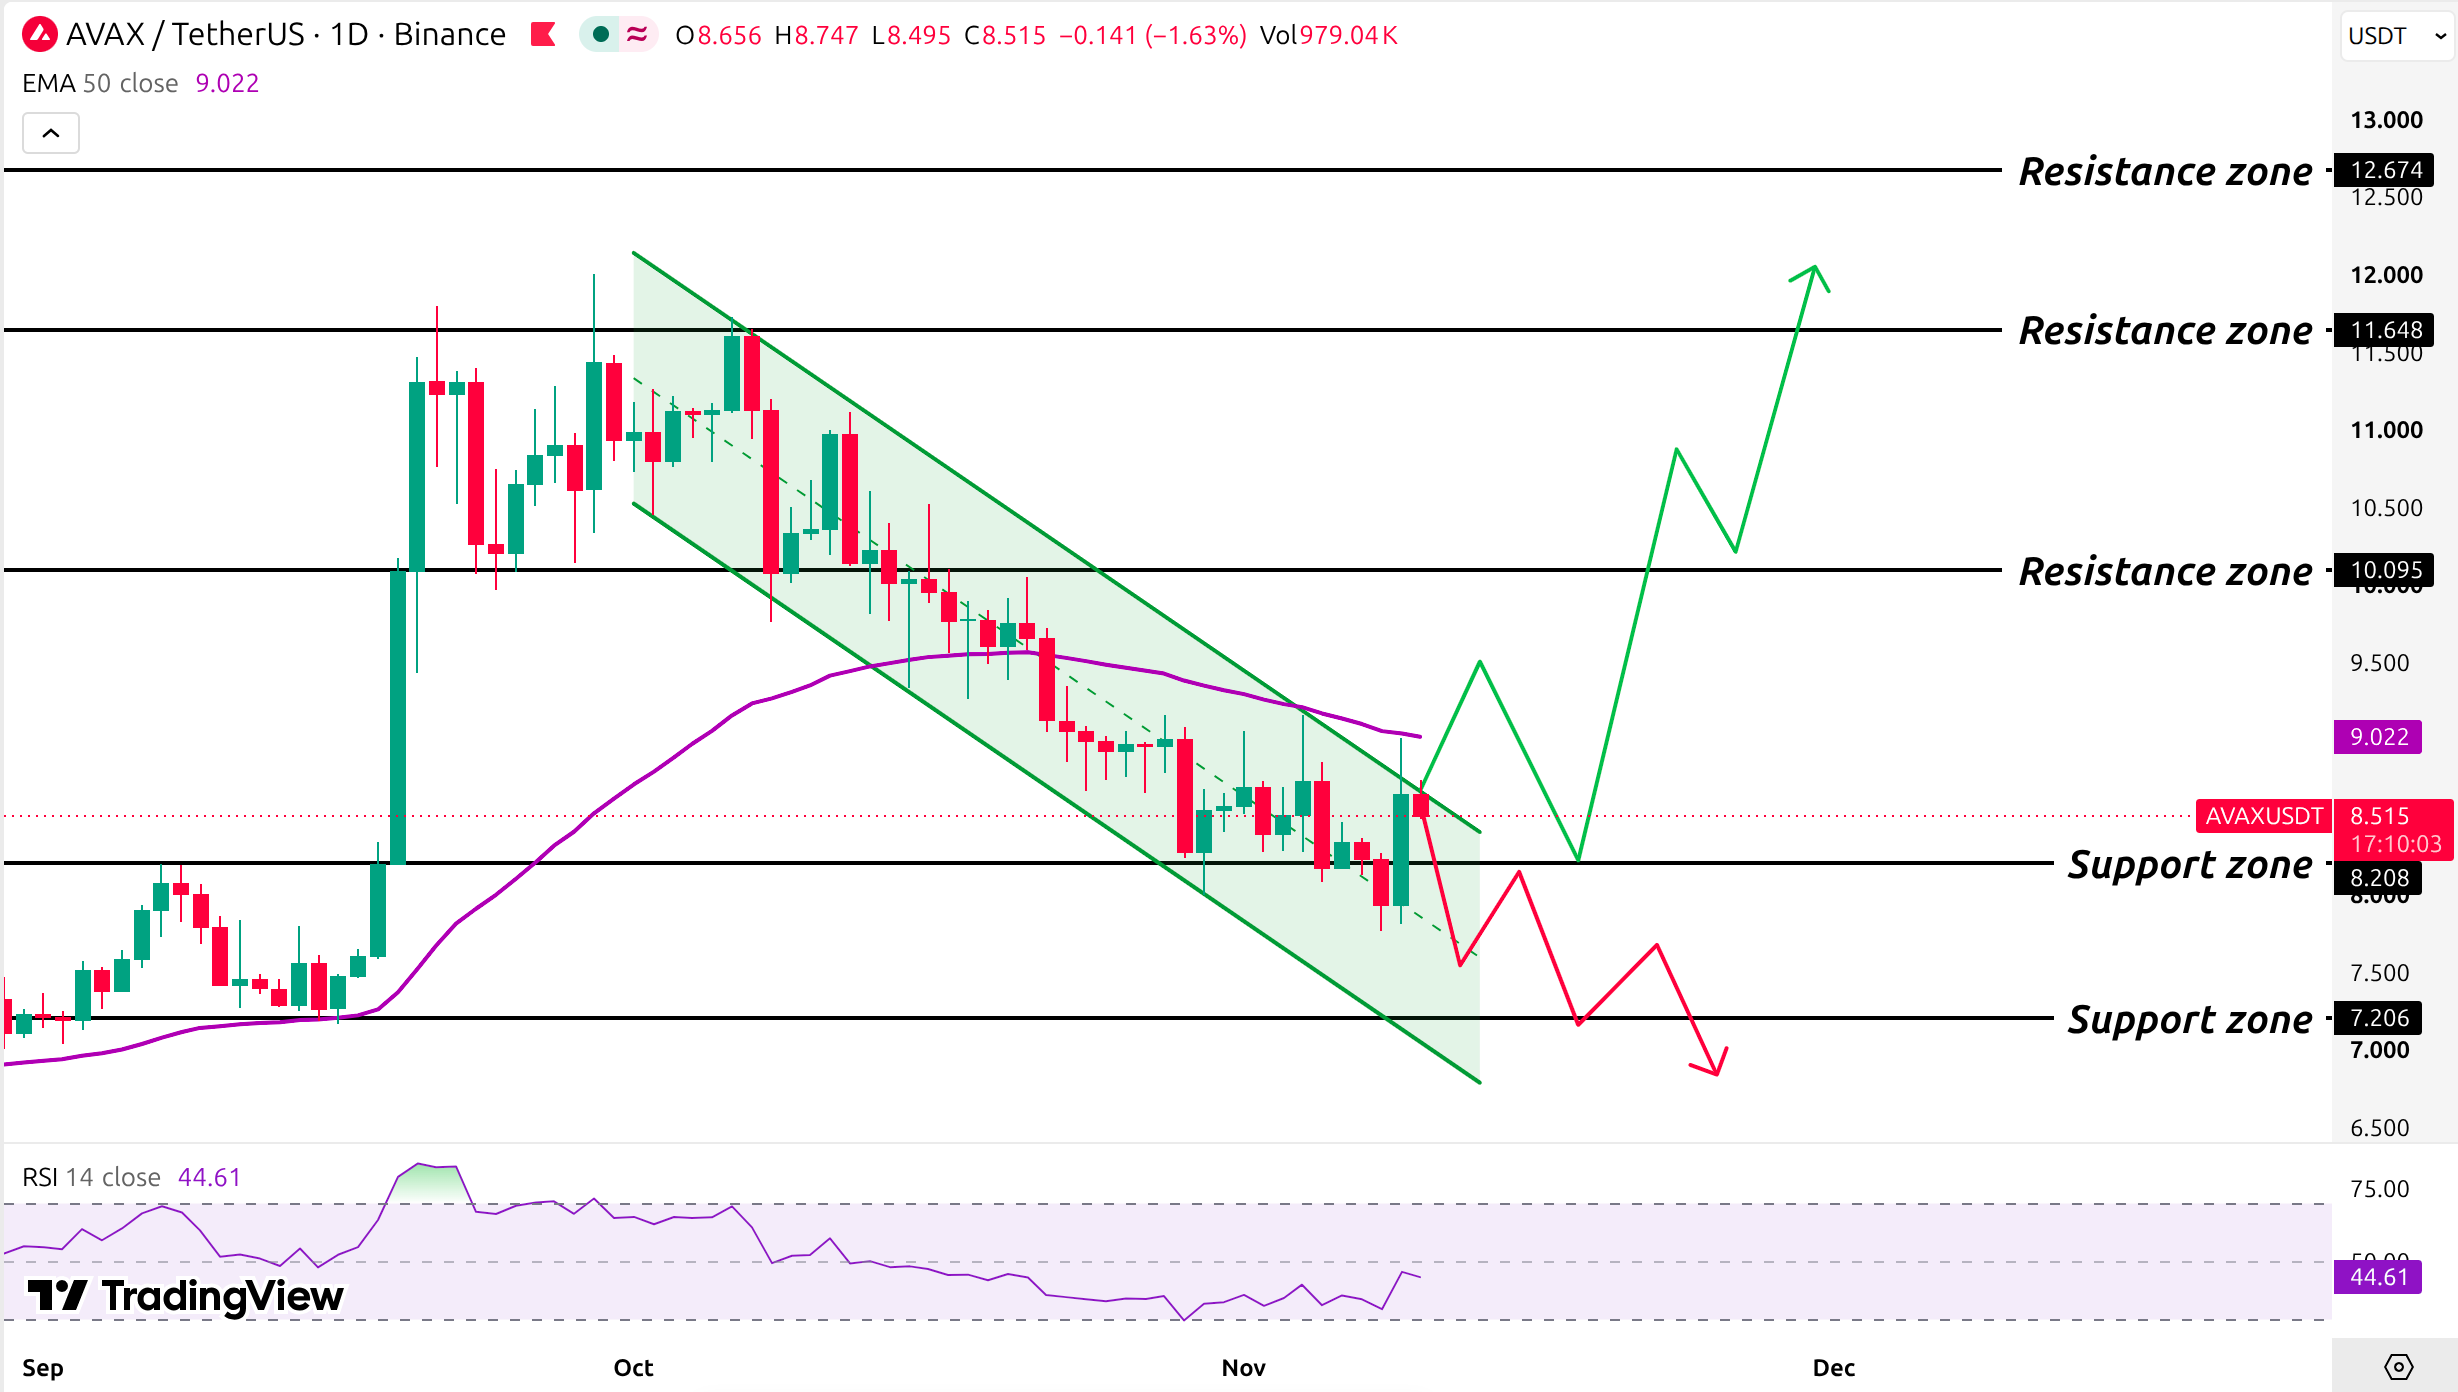
Source: TradingView, AVAX/USDT 1D, EMA 50, and RSI 14, November 10, 2026, 06:54 UTC
The Binance 1D chart for $AVAX/USDT on TradingView, captured Nov 10, 2026, 06:54 UTC, frames this Avalanche price prediction. A sharp September rally spiked to the $11.648 level before sellers took control.
Price held the $7.206 support zone, where buyers had stepped in, then rallied through $8.208 and $10.095, a run also tracked in the October Avalanche forecast, until the $11.648 resistance zone, where sellers had appeared and turned it back.
A descending channel, two falling parallel trendlines that hold price between support and resistance, formed from the early-October peak, and sellers defended the upper trendline of the channel every time. Right now, price trades above the $8.208 level but below the upper trendline of the channel and the $9.022 50-day EMA level.
The $AVAX 50-day EMA sits at $9.022, and $AVAX's $8.51 price trades 5.7% below it. The latest daily candle trades below the EMA. The upper trendline sits near it, so a real recovery needs both levels to break.
The $AVAX RSI reads 44.61 on the 14-day setting. Under 50 means sellers hold the momentum edge. A reading above 30 means oversold conditions haven't formed and price has room to fall.
AVAX Support Levels and Resistance Levels
Level | Role |
$7.206 | Support |
$8.208 | Support |
$9.022 | 50-day EMA |
$10.095 | Resistance |
$11.648 | Resistance |
$12.674 | Resistance |
Support marks where buyers have stepped in. Resistance marks where sellers have. The nearest levels are $8.208 below and $9.022 above.
Avalanche Price Prediction: Bull, Base, and Bear Scenarios
Scenario | Trigger | Target | Invalidation |
Bull | Daily candle trades above the $9.022 EMA level | $10.095 | Back below the $8.208 level |
Base | Range between $8.208 and $9.022 levels | Range trade | Break of either level |
Bear | Daily candle trades below the $8.208 level | $7.206 | Daily candle trades above the $9.022 level |
Regulatory delay is a risk, since the NYSE-linked platform is still upcoming. ETF flow reversal is another, because net outflows remove a small bid. Technical invalidation means a daily candle trading above $9.022 for bears or below $8.208 for bulls.
Expert Outlook on the Avalanche Price Prediction
As per CoinGabbar analysis, The base range wins for now. ETF flow sits at $0.00, price trades 5.7% under the 50-day EMA, and liquidations show a futures-led rally. Watch the next SoSoValue update, since a positive net inflow with a daily candle above $9.022 would confirm spot demand.
Disclaimer: This article is for information only and isn't financial advice. Traders should do their own research and risk only what they can afford to lose.