Avalanche Price Prediction November 2026: Can AVAX Hold $8.43?

What happens when a $105B Goldman Sachs bond fund starts letting big investors borrow against it on Avalanche? Could that Wall Street attention keep AVAX above $8.43?
Avalanche price prediction November 2026 opens with a weak daily setup. AVAX trades at $8.72, down 3.2% in 24 hours. The previous Avalanche forecast covered the October path.
AVAX Price Forecast: 24-Hour Market Snapshot
That frames the Avalanche price prediction November 2026, since buyers must retake the EMA first. CoinGecko market data below is as of Oct 29, 2026, 6:40 UTC.
Metric | Value |
Price | $8.72 |
Market cap | $3.87B |
FDV | $4.102B |
24h volume | $219.7M |
Perps open interest | $2.916B |
FDV (fully diluted value) prices every token in total supply at today's rate. At $4.102B against a $3.87B market cap, little extra supply is waiting to hit the market.
Avalanche ETF Flows: Cumulative Net Inflow Sits at $31.63M
SoSoValue ETF data as of Oct 28, 2026, shows a cumulative net inflow of $31.63M. ETF net assets, the total value of AVAX the funds hold, are $50.55M, or 1.26% of AVAX market cap.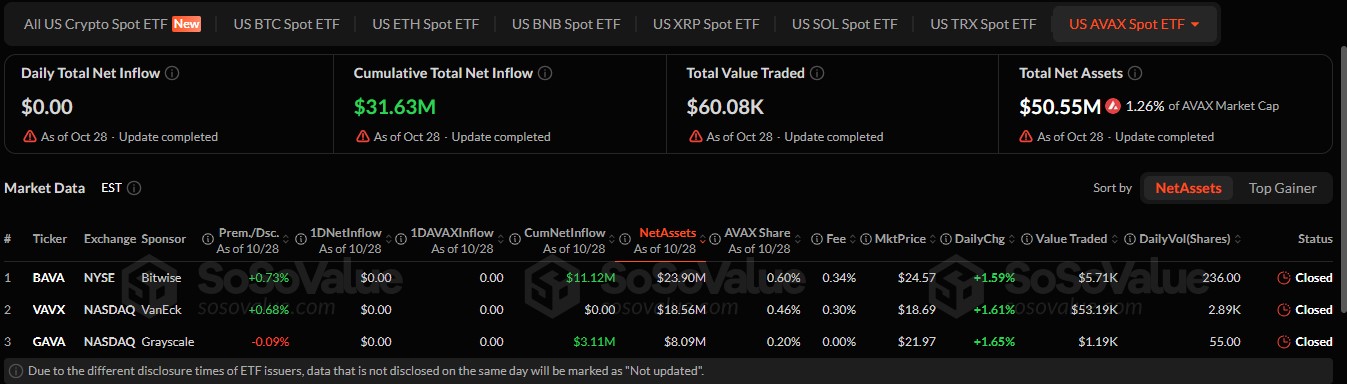
By fund, Bitwise's BAVA holds $23.90M in net assets. VanEck's VAVX holds $18.56M, and Grayscale's GAVA holds $8.09M.
Flat flows mean the funds aren't adding fresh buying, and they aren't selling either. Inflows would put real spot demand under price, and outflows would do the opposite. More fund headlines sit in the crypto news feed.
Avalanche Liquidation Data: Longs Took the Hit
$1.16M liquidated in 24 hours. Longs lost $714.90K, and shorts lost $446.20K.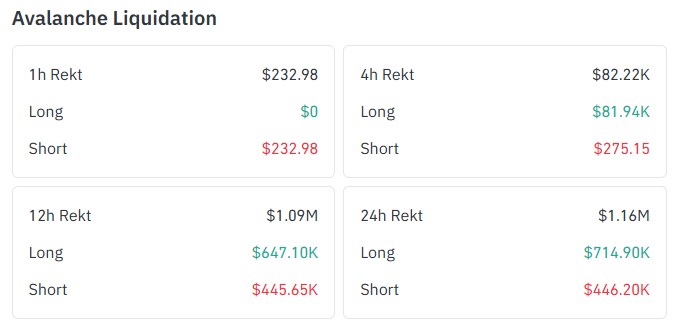
Over the last 12 hours, Longs took $647.10K of the losses. Forced long selling pushes price down.
This Avalanche liquidation data comes from CoinGlass futures pages, captured Oct 29, 2026, 6:40 UTC.
Avalanche Open Interest and Futures Volume
Open interest is the total value of futures contracts still open, as this open interest explainer details. Avalanche open interest is $2.916B in the CoinGecko perps data above.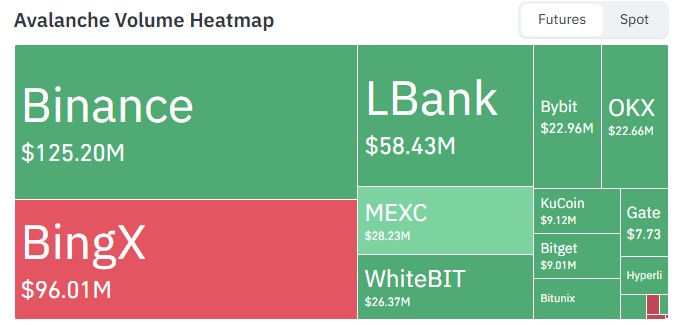
CoinGlass's volume heatmap, captured Oct 29, 2026, 6:40 UTC, puts Binance first in 24h futures volume at $125.20M. BingX is second at $96.01M.
Open interest of $2.916B against a falling price means many borrowed-money positions are open. A sharp move can force more liquidations.
AVAX Technical Analysis: Falling Wedge, EMA, and RSI
The daily AVAX/USDT chart tells the story. See the October price prediction too.
Price first consolidated near $7.206 levels. A sharp breakout happened and touched the $11.810 level.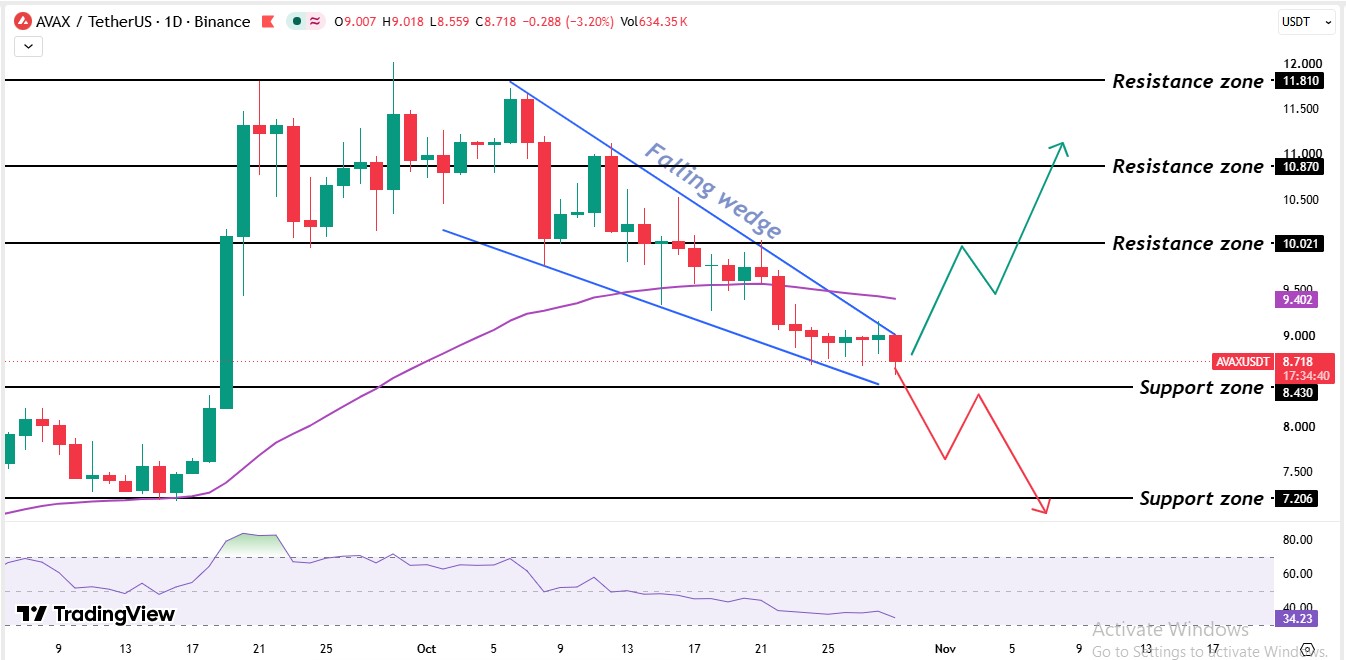
And after that, the price started going downward by making lower highs and lower lows since early October and formed a falling wedge, a pattern where price squeezes between two falling lines. Price is still in a downtrend and testing the $8.43 support level.
On the Avalanche chart, 50 EMA sits at $9.40, above the price at $8.72. Price under it means the trend leans down, and the line acts as a ceiling.
RSI (relative strength index) reads 34.2. A reading under 50 means sellers lead, and it's still above 30, so there's room to fall.
Avax Support and Resistance Levels
Type | Level |
Support | $8.430 |
Support | $7.206 |
Resistance | $9.402 (EMA) |
Resistance | $10.021 |
Resistance | $10.870 |
Resistance | $11.810 |
Avalanche support levels are areas where buyers stepped in before, and avalanche resistance levels mark where sellers defended the level. The nearest are $8.43 below and $9.40 above.
Avalanche Bull, Base and Bear Scenarios
Scenario | Trigger | Target | Invalidation |
Bull | Daily candle above $9.40 | $10.02 | Back below $9.40 |
Base | Range of $8.43 to $9.40 | Same range | Daily candle outside it |
Bear | Daily candle below $8.43 | $7.206 | Daily candle above $9.40 |
Regulatory delay may slow the institutional adoption behind the Lynq news. An ETF-flow reversal into outflows would add sell pressure. And a daily candle above $9.40 would invalidate the bearish read.
Avalanche price prediction November 2026 : Expert Outlook
As per CoinGabbar analysis, the bias is bearish. AVAX trades under the EMA at $9.40, the RSI reads 34.2, and longs lost $714.90K in 24 hours. The Avalanche price prediction November 2026 stays bearish while there are no daily candle trades above $9.40.
Watch $8.43. A daily candle trading below it opens $7.206, while holding it keeps the range alive.
Disclaimer: This article is for information only and isn't financial advice. Traders should do their own research and risk only what they can afford to lose.



















