Bitcoin Faces $85K Test as Fed Hike Odds Fall From 57.6% to 15.5%


Bitcoin is trading near $82,685 after a choppy day. Yesterday, buyers pushed the price to the top of its channel near $85,000. Sellers then took control.
Fresh Iran news and mixed results from Tesla and Meta pushed Nasdaq futures lower. That revived doubts about the AI trade, and crypto followed.
Now $85,000 is the big test for Bitcoin.
Why Is Bitcoin Down Today?
The pressure came from outside crypto. Stocks wobbled, and BTC moved with them. The Fed meeting on October 28 also keeps traders careful.
Peter Schiff added to the worry. He said export prices rose 2.2% in a month, about 30% annualized. Producer prices rose 1.3%, a 17% annual rate.
Oil also hit a five-month high of $110. Those are his figures and his view.
What Are the Odds of a Fed Rate Hike on October 28?
CME data from October 21 shows an 84.5% chance the Fed holds rates at 3.75% to 4.00%. A hike to 4.00% to 4.25% sits at 15.5%. A cut is priced at 0%.
The mood changed fast. A month ago, traders priced a hike at 57.6%.
Outcome | Now (Oct 21) | 1 Week Ago | 1 Month Ago |
No change (3.75% to 4.00%) | 84.5% | 66.8% | 42.4% |
Hike (4.00% to 4.25%) | 15.5% | 33.2% | 57.6% |
Cut | 0% | 0% | 0% |
A hold is now the base case. A surprise could move prices either way.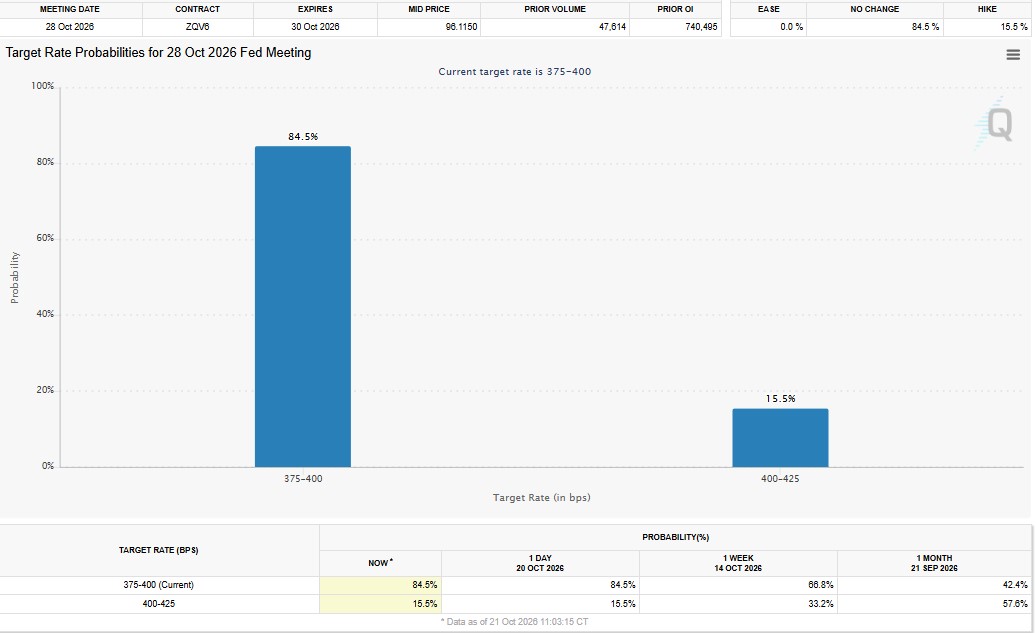
Are Institutions Still Buying BTC?
Looks like it. SoSoValue data shows U.S. spot BTC ETFs took in $528.40 million in net inflows on October 21.
BlackRock's IBIT led with $235 million, its largest daily inflow in a month. ETF trading value hit $3.15 billion.
Strong flows show demand. They do not promise a direction.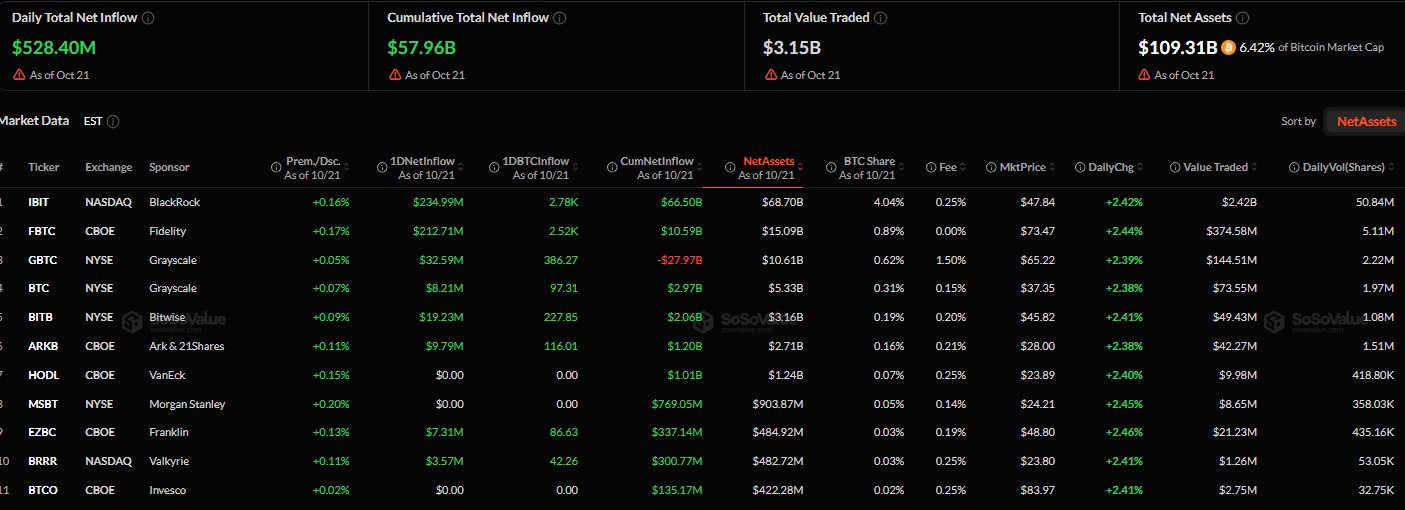
What Do BTC Futures and Open Interest Data Show?
Traders are leaning slightly long. Rising open interest means more money is in play, so moves can get bigger in either direction.
Metric | Value | 24h Change |
Futures volume | $75.84B | +38.52% |
Open interest | $53.95B | +1.32% |
Options volume | $6.60B | -2.22% |
Options open interest | $40.20B | +1.90% |
Overall long/short ratio | 1.0239 | n/a |
Binance accounts long/short | 1.4462 | n/a |
OKX accounts long/short | 1.57 | n/a |
Binance top traders (accounts/positions) | 1.5667 / 1.4681 | n/a |
BTC has a $1.66 trillion market cap, with $6.54 billion in spot volume.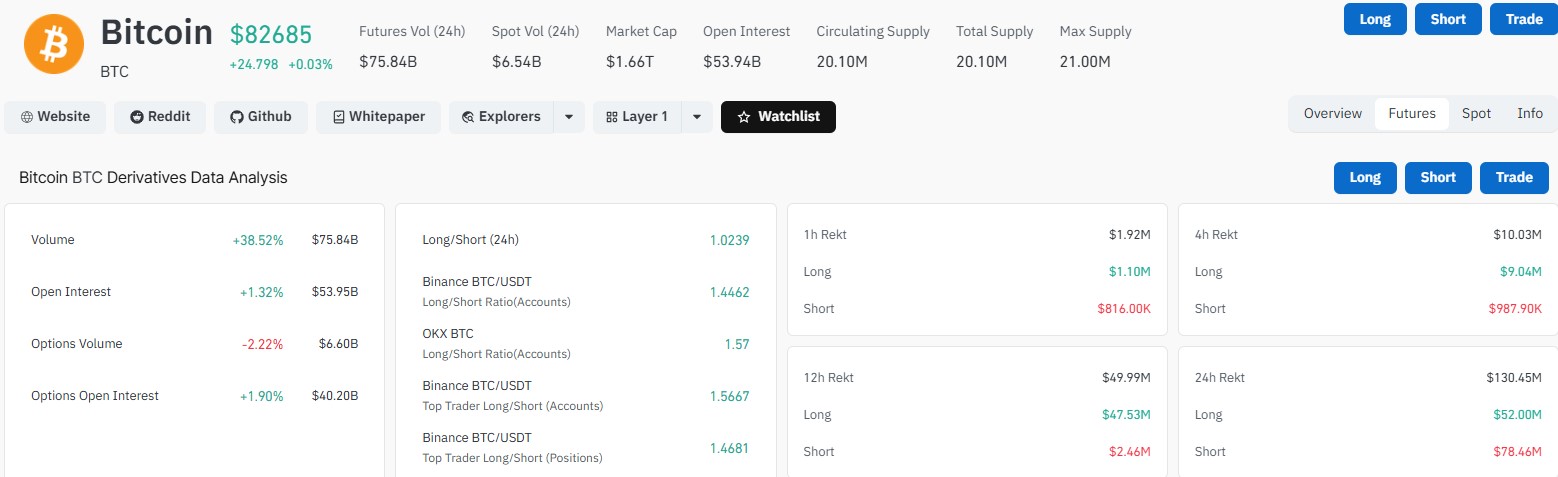
Where Are BTC Liquidations Concentrated?
In 24 hours, $130.45 million was liquidated. Shorts lost $78.46 million, and longs lost $52 million.
Period | Total | Longs | Shorts |
1 hour | $1.92M | $1.10M | $816K |
4 hours | $10.03M | $9.04M | $987.90K |
12 hours | $49.99M | $47.53M | $2.46M |
24 hours | $130.45M | $52.00M | $78.46M |
Recent losses were mostly longs, after the drop from $85,000.
Max pain data from a price of $82,681.30 shows short max pain at $85,416.14, which is 3.31% higher. Long max pain is $82,300.46, only 0.46% lower.
The heatmap also shows thick clusters near $85,500 and $82,300. A small dip could hit longs. A push higher could squeeze shorts.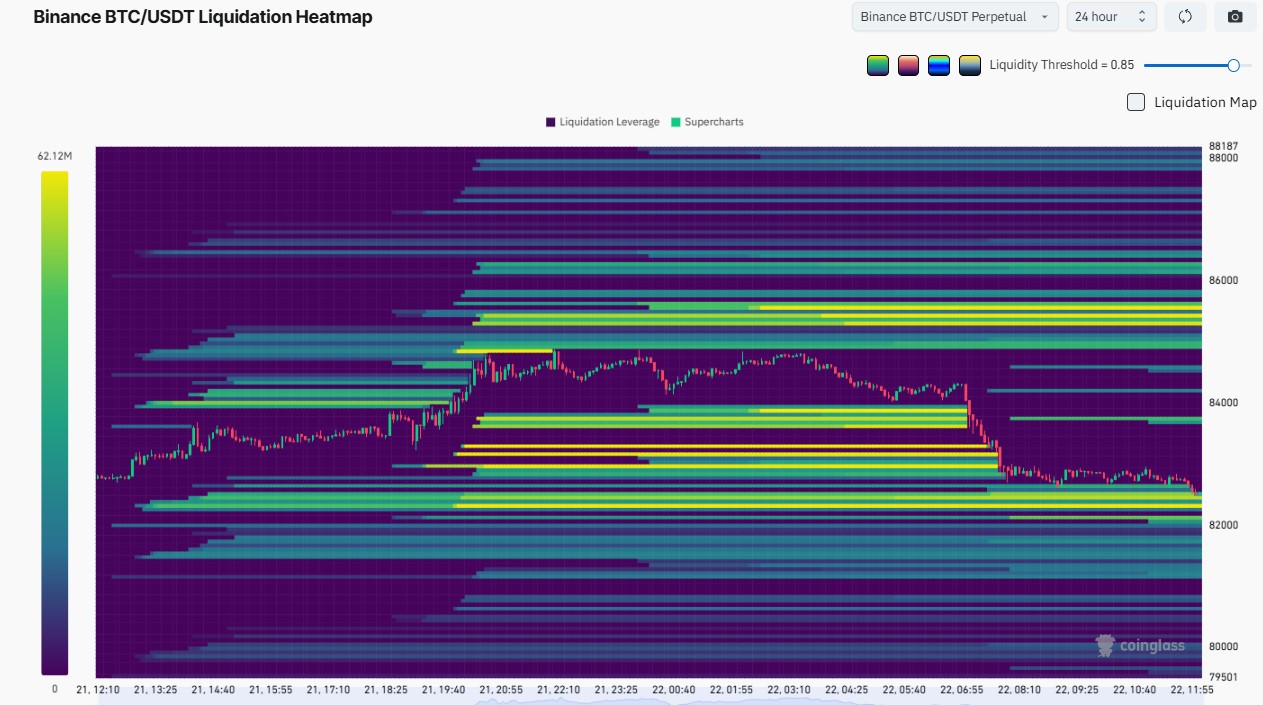
Could Bitcoin Fall Further? Key Support and Resistance Levels
On the daily chart, BTC moves inside a descending channel. That points to short-term consolidation with a slight bearish bias. A second, larger channel sits below.
Price is testing the 20-day EMA near $82,679. RSI is about 51, so momentum is neutral.
Level | Why It Matters |
$87,404 | Major resistance |
$85,000 | Channel top and short max pain area |
$84,000 | Near-term resistance |
$82,679 | 20-day EMA, tested now |
$82,000 to $80,836 | Support, 50-day EMA at $80,836 |
$78,000 to $77,420 | Next support, 100-day EMA at $77,420 |
$76,144 | 200-day EMA |
$74,000 to $72,000 | Lower channel boundary |
A break above the trendline with strong volume could open at $85,000, then $87,400. If BTC loses $82,000 to $80,800, a slide toward $78,000 to $77,400 is possible.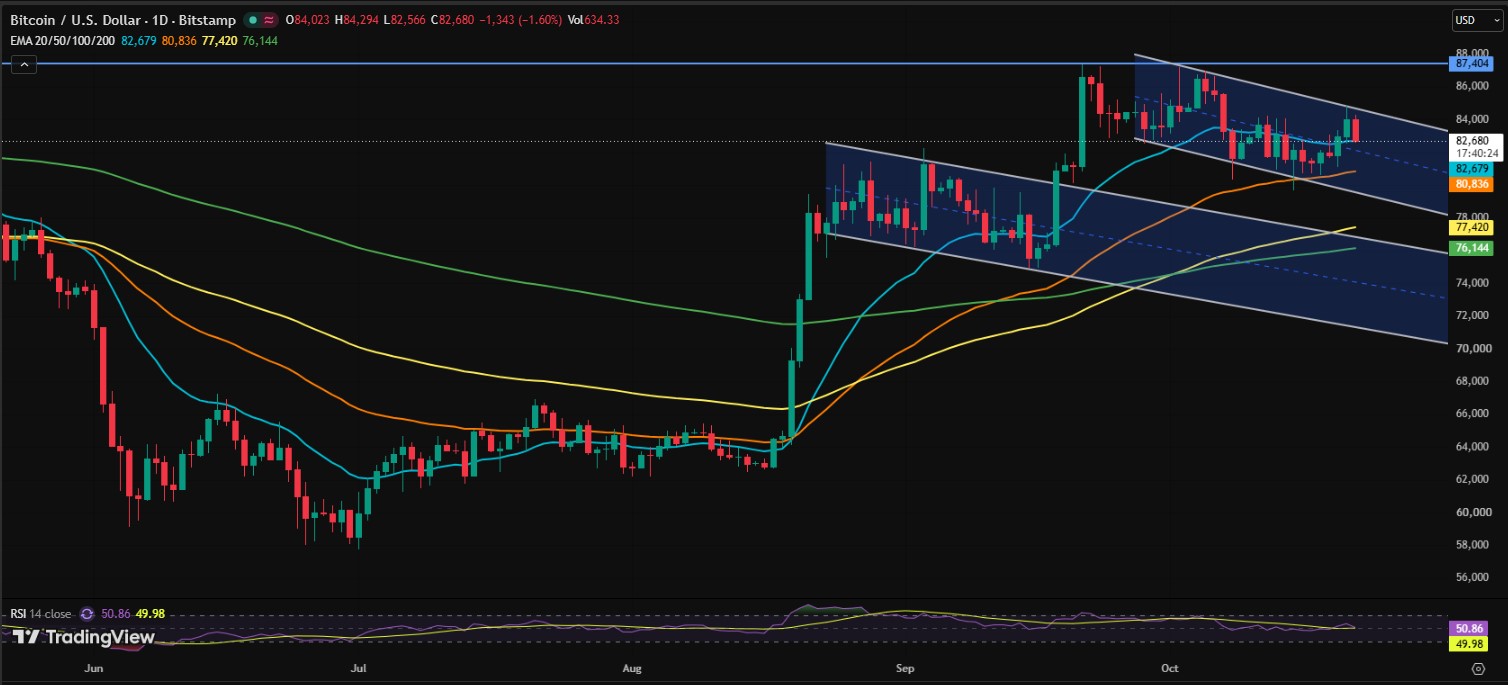
Will BTC Hit $100K Again? Analyst View
Analyst Javon Marks says BTC shows notable strength after signs of another breakout. His chart shows three falling wedges, each followed by a breakout.
He sees a push toward $100,000 or higher as possible, with a retest of $116,000 on the table.
That is his view, not a certainty. $100,000 is about 21% above the current price, and $87,404 must be cleared first.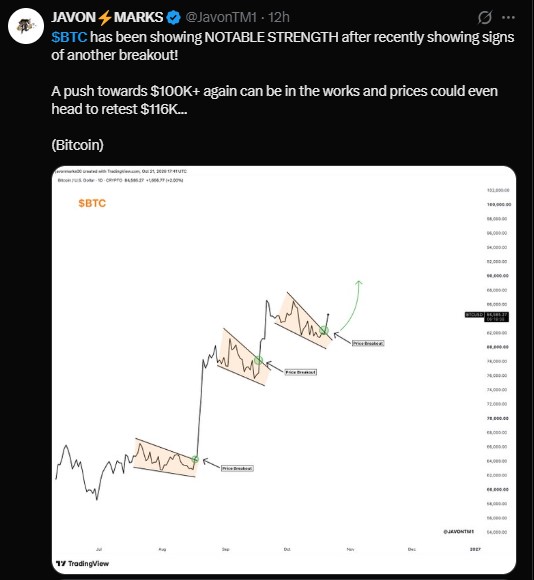
What Is the Outlook for BTC This Week?
Sentiment looks cautiously bullish but volatile. The Fed decision on October 28, oil, Nasdaq moves, and ETF flows will all matter.
For Bitcoin, a daily close above $85,000 would be a strong sign. A drop under $82,000 would put $80,800 in focus. Waiting for confirmation may be wiser than guessing.
Disclaimer
This article is for information only and is not financial, investment or trading advice. Crypto assets are volatile and carry a high risk of loss. Figures come from the data and sources cited and may change quickly. Always do your own research and speak with a licensed financial advisor before making any decision.