Bitcoin Fell After Every US Midterm Election: Will BTC Repeat in 2026?


Bitcoin has a rough history around US midterm elections. The next vote is on November 3, just 11 days away.
Analyst Ali Martinez, who posts as Ali Charts, says investors may be overlooking a historical pattern. The chart he shared on X shows a steady slide of lower midterm-year lows, ending near -30%. His warning is simple: if history repeats, a major correction could follow.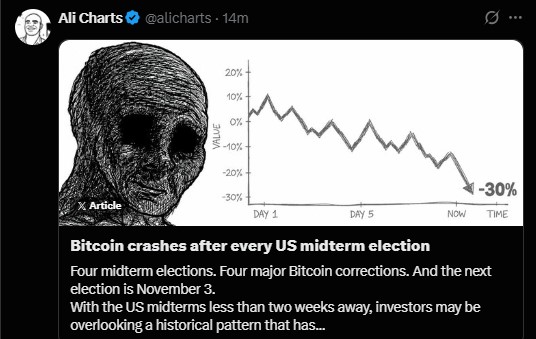
BTC trades near $82,000 today. So could Q4 2026 become another painful quarter? Here is what the old pattern says, and how much weight traders should give it.
Does Bitcoin Crash After Midterm Elections?
In each of the last four midterm cycles, BTC fell hard. The decline shrank each time, and Martinez’s chart shows that trend heading toward -30%.
Midterm Year | BTC Decline | Q4 Return |
2010 | -72% | +391% |
2014 | -65% | -16.70% |
2018 | -52% | -42.16% |
2022 | -27% | -14.75% |
Source: data shared by Ali Martinez (Ali Charts) on X.
Even the smallest drop in 2022 was 27%.
Martinez is clear that correlation does not equal causation. Those falls also matched the wider market cycle, liquidity, and investor mood.
What Happens to Bitcoin in Q4 of a Midterm Year?
Three of the last four midterm years ended Q4 in the red: 2014, 2018 and 2022.
The exception was 2010, a gain of 391%. The asset was still in its infancy then, so it is a weak data point.
That brings back the big question. Could Q4 2026 become another painful quarter? Three losing quarters are worth noting, but four data points are not a rule.
Is Bitcoin Going to Crash in November 2026?
Price has been quiet. Over the past week, BTC held between $80,000 and $84,000, according to K33 research. Its 28-day volatility fell to 1.2%, near the lowest level of 2026.
Quiet markets rarely stay quiet. K33 expects bigger moves because two events are close together: the Federal Reserve decision on October 28 and the midterms on November 3. Markets price in about an 80% chance the Fed leaves rates unchanged.
The all-time high is about $126,000, set in October 2025. Price now sits roughly 35% below it.
What Is the Bitcoin Short-Term Holder Cost Basis?
The short-term holder cost basis is the average price paid by people who bought recently. When price falls to that average, recent buyers are near break-even.
Analysts use it to judge market sentiment. One trader quoted by Benzinga says the level has held through past bull-market corrections. Whether this is still a bull market is something traders disagree on.
Why Is $73,000 Important for Bitcoin Right Now?
Martinez says $73,000 is the level he is watching if selling speeds up after the vote. It sits close to the short-term holder cost basis.
From $82,000, $73,000 is about 11% lower.
Could Bitcoin Break the Midterm Pattern in 2026?
Not everyone expects a repeat. Trader Castillo Trading argues BTC may have already bottomed near $58,000 over the summer, about five months earlier than usual.
Binance Research found an average drop of about 56% in completed midterm cycles since 2014, followed by an average gain of about 54% the next year. Alphractal also notes only two comparable elections exist.
So the same history can be read two ways: a drop first, then a recovery.
What Bitcoin Price Levels Should Traders Watch After November 3?
These levels use $82,000 as a base. They are reference points, not forecasts.
Level | Distance From $82,000 | Why It Matters |
$84,000 | +2.4% | Top of the recent range |
$82,000 | 0% | Close to current price |
$80,000 | -2.4% | Bottom of the recent range |
$73,000 | -11.0% | Short-term holder cost basis |
$59,900 | -27.0% | Same size drop as 2022 |
$58,000 | -29.3% | Summer low cited by traders |
An 11% fall to $73,000 would be smaller than any of the four midterm drops. A repeat of 2022 would put BTC near $59,900, close to the summer low.
Will Bitcoin Drop After the November 3 Midterms?
Nobody knows. History leans one way, but the sample is small, and the market may have priced in part of the move.
Traders will likely watch the Fed decision, whether BTC holds $80,000, and how it reacts near $73,000. If selling hits, those levels may show how deep it goes.
Disclaimer
This article is for information only and is not financial, investment, or trading advice. Crypto assets are volatile, and you can lose some or all of your money. Past performance does not guarantee future results. Do your own research and speak with a licensed financial advisor before you invest.

















