Bitcoin Loses 50-Day Average for First Time Since August: What Next?


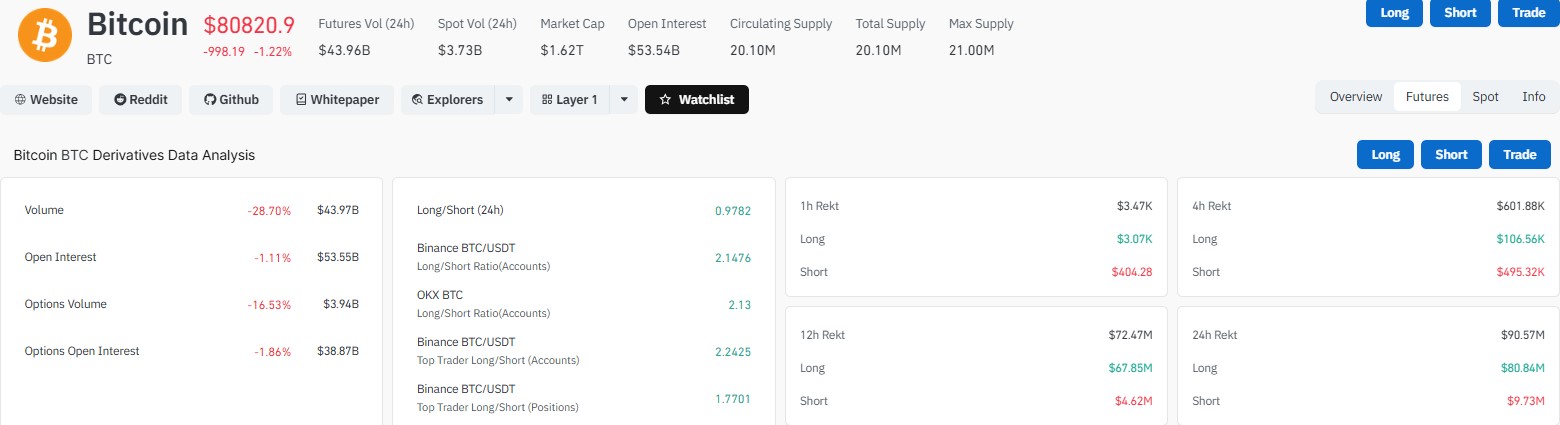
Bitcoin is trading near $80,820, down 1.22% or $998.19 in the past 24 hours. Its market cap sits around $1.62 trillion. Circulating supply is 20.10 million of the 21 million maximum.
For the first time since August, BTC closed a daily candle below its 50-day moving average. It is a small shift, but traders are watching it closely.
Why Is BTC Down Today?
Trading activity cooled. Futures volume dropped 28.70% to $43.96 billion, while spot volume came in at $3.73 billion.
Options slowed too. Less activity often means traders are waiting for a clearer signal.
Metric | Value | 24h Change |
Futures volume | $43.96B | -28.70% |
Spot volume | $3.73B | n/a |
Open interest | $53.54B | -1.11% |
Options volume | $3.94B | -16.53% |
Options open interest | $38.87B | -1.86% |
Market cap | $1.62T | n/a |
What Does the BTC Daily Chart Show?
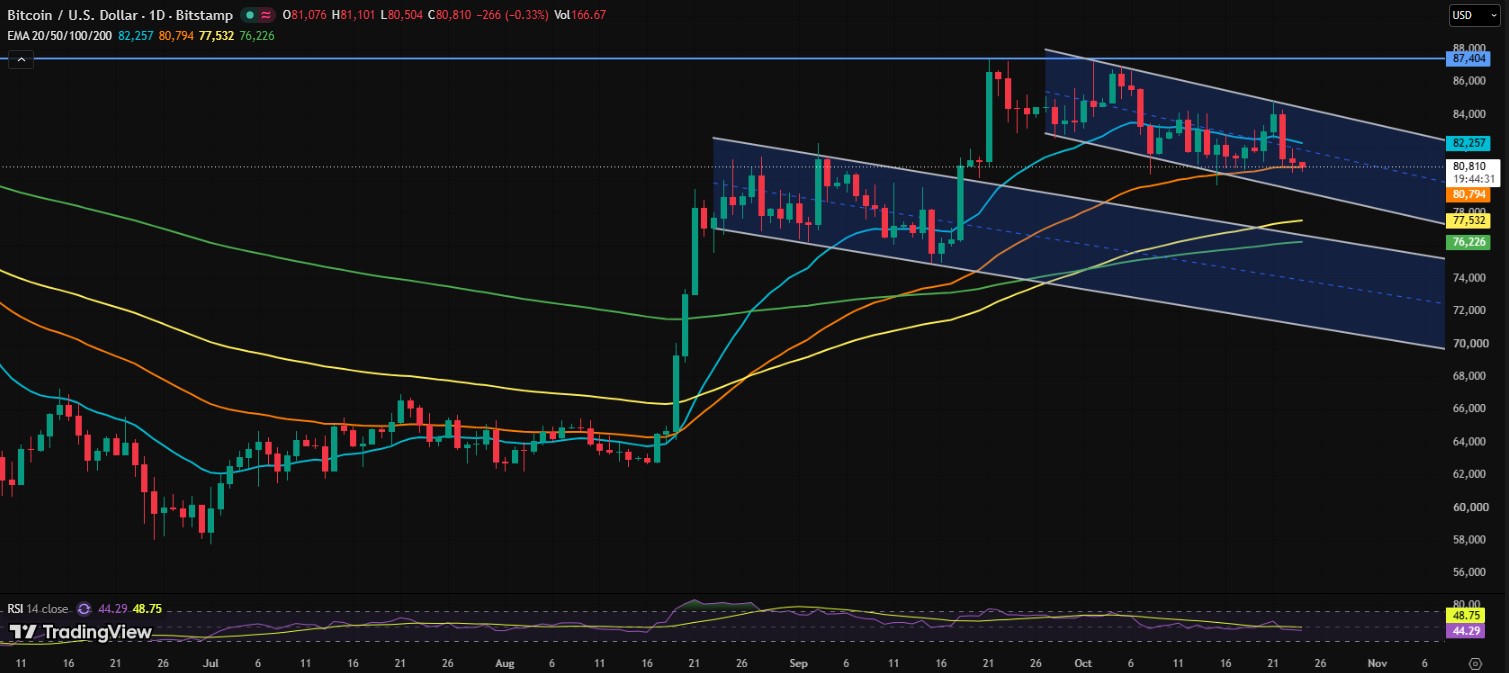
BTC is moving inside a descending channel after its rally toward $87,404. The daily candle opened at $81,076, touched a low of $80,504 and sat near $80,810, down 0.33% on the day with volume of 166.67.
Price is below the 20-day EMA at $82,257 and hugging the 50-day EMA at $80,794. The 100-day EMA is at $77,532, and the 200-day EMA is at $76,226.
RSI reads 44.29, under the neutral 50 mark. Its signal line is at 48.75. That points to soft momentum, not a collapse.
What Are the Key BTC Support and Resistance Levels?
Level | Role | Note |
$87,404 | Resistance | Recent high |
$84,000 to $85,000 | Resistance | Recovery zone |
$82,300 | Resistance | Near 20-day EMA |
$80,794 | Pivot | 50-day EMA |
$80,000 to $79,500 | Support | Key zone |
$78,000 | Support | Next target if broken |
$77,532 | Support | 100-day EMA |
$76,226 | Support | 200-day EMA |
Will the Fed Cut Interest Rates in October 2026?
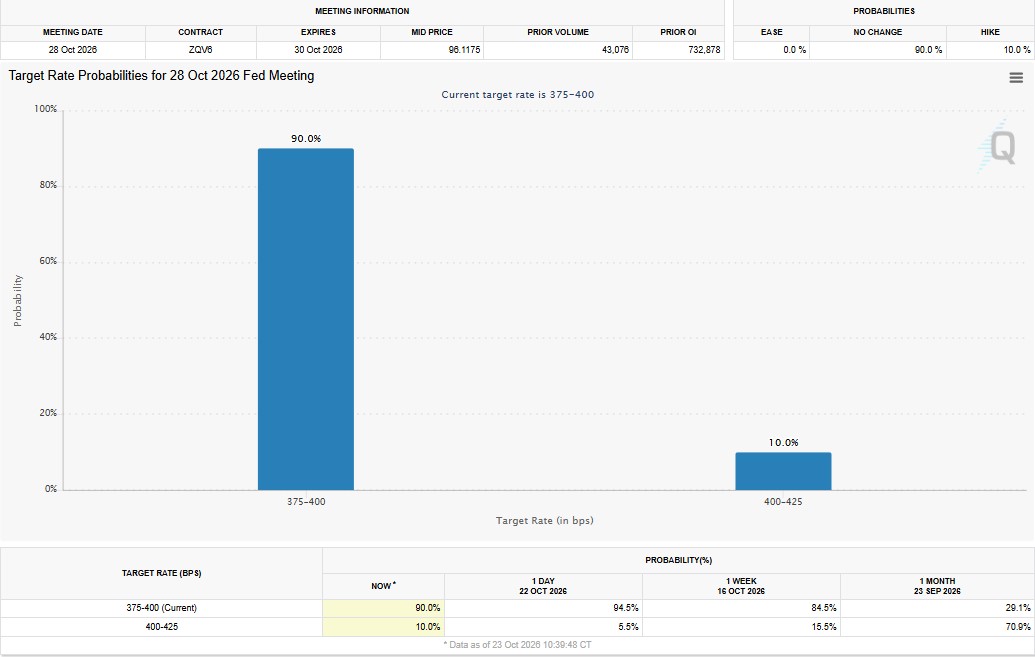
Unlikely. The Fed meets on October 28, and the current rate is 3.75% to 4.00%. Data from October 23 shows a 90% chance of a hold, a 10% chance of a 25 basis point hike to 4.00% to 4.25%, and 0% for a cut.
Hike bets have faded over the month. Ten percent is still not zero, though.
Time | Hold | Hike |
Now | 90.0% | 10.0% |
1 day ago | 94.5% | 5.5% |
1 week ago | 84.5% | 15.5% |
1 month ago | 29.1% | 70.9% |
How Many Bitcoin Longs Were Liquidated Today?
As per CoinGlass data, Liquidations hit $90.57 million over 24 hours. Longs took $80.84 million of that, and shorts took $9.73 million.
Most of the damage came earlier. The 12-hour total was $72.47 million, with $67.85 million in longs. The last 4 hours saw only $601.88K, and the last hour just $3.47K.
The overall 24-hour long/short ratio is 0.9782, a slight lean to shorts. But account ratios look different: 2.1476 on Binance, 2.13 on OKX, and 2.2425 for Binance top traders. Top trader positions show 1.7701. The mix is not one-sided.
Window | Total | Long | Short |
1 hour | $3.47K | $3.07K | $404.28 |
4 hours | $601.88K | $106.56K | $495.32K |
12 hours | $72.47M | $67.85M | $4.62M |
24 hours | $90.57M | $80.84M | $9.73M |
Where Are BTC Liquidation Levels Today?
The Binance BTC/USDT 24-hour heatmap shows bright bands on both sides of price. One sits near $82,300 to $82,500, and another near $80,300 to $80,500. Lighter zones appear around $78,000.
That matches the max pain data. Short max pain is $82,296.12 (value $33.73M), which is +1.86% or $1,500.82 above price. Long max pain is $80,300.61 (value $36.91M), just below the market.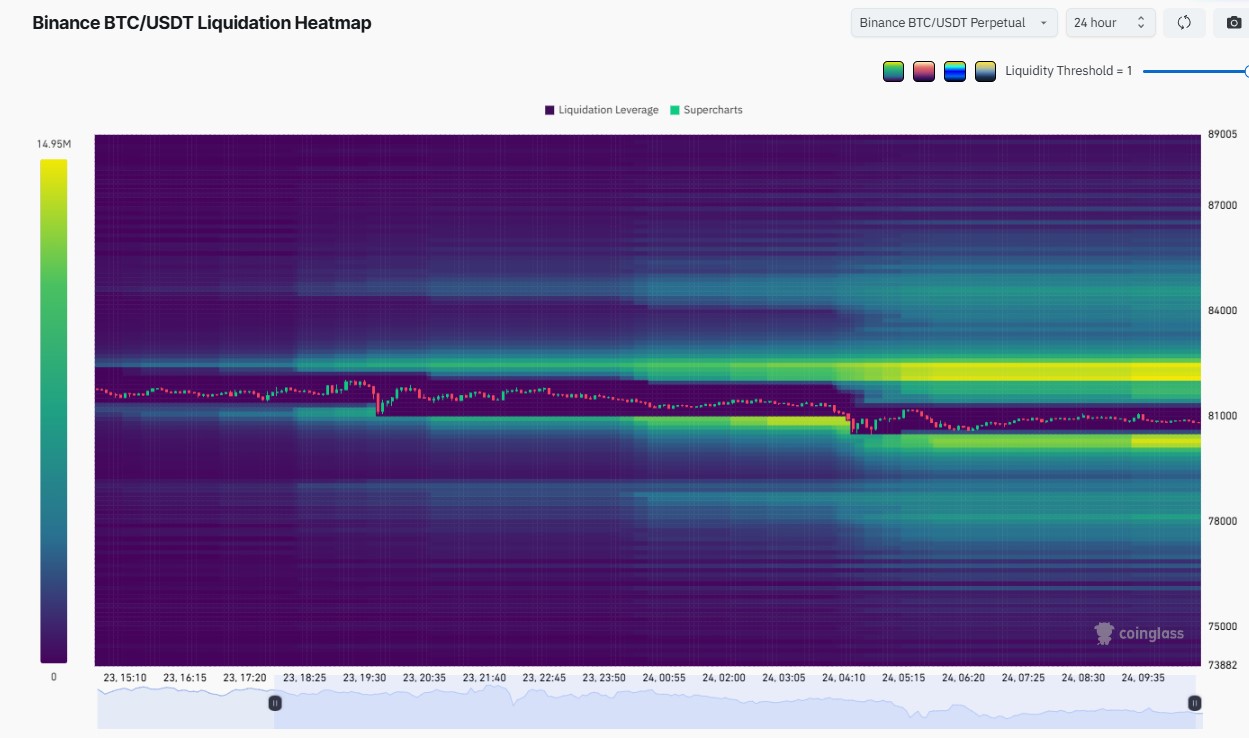
What Did CZ Say About Bitcoin?
CZ, the Binance co-founder, posted on X that many people have called BTC dead before. He added that those moments were often the best times to buy.
It is an opinion, not a signal. Still, it shows how split the mood is.
What Is the Bitcoin Outlook for the Coming Days?
The short-term view looks bearish to neutral. If Bitcoin loses the $80,000 to $79,500 zone, it could slide toward $78,000 and maybe $76,200.
If buyers defend that zone and push above $82,300, a move toward $84,000 to $85,000 is possible. Stronger resistance waits near $87,400.
Nothing here is certain. The Fed meeting on October 28 may add volatility either way.
Disclaimer
This article is for information only and is not financial, investment, or trading advice. Cryptocurrency prices are highly volatile, and you can lose some or all of your money. Always do your own research and speak with a licensed financial advisor before making decisions.



















