Bitcoin Price Today: Will CPI Data Push BTC Above $87K or Below $80K?


Bitcoin price is holding near $83,545 as traders wait for two big events. US inflation data comes out on October 14. Fed Chair Kevin Warsh speaks on October 15.
Bitcoin is up $531.29, or 0.64%, in the past 24 hours. The mood looks calm, but the week could get bumpy.
What Is the Bitcoin Price Today?
The BTC price today is $83,545. The market cap is $1.68 trillion.
Futures volume jumped 97.25% to $34.92 billion. Spot volume is much smaller at $2.91 billion.
Metric | Value |
Price | $83,545 |
24h change | +0.64% |
Market cap | $1.68T |
Futures volume (24h) | $34.92B |
Spot volume (24h) | $2.91B |
Open interest | $52.44B |
Circulating supply | 20.09M of 21M |
Why Is Bitcoin News Today All About CPI and the Fed?
The latest BTC news today is mostly about inflation. ForexFactory data shows traders expect September headline CPI at 3.7% year over year. August was 3.4%.
Core CPI, which skips food and energy, is expected to rise from 2.4% to 2.5%.
Oil prices are climbing too. This is happening even though President Trump says the US will not strike Iran again before the midterms.
A hotter reading could push BTC lower. Markets may start pricing in rate hikes in 2026.
Warsh could also shift those odds in Thailand. Traders want to know if he will talk about inflation or more hikes at the October and December FOMC meetings.
What Do the Charts Say About the BTC Price Prediction?
On the daily chart, price sits above all four key moving averages. That points to a recovery trend that is still alive.
The RSI is near 54. That is mild momentum, not overheated.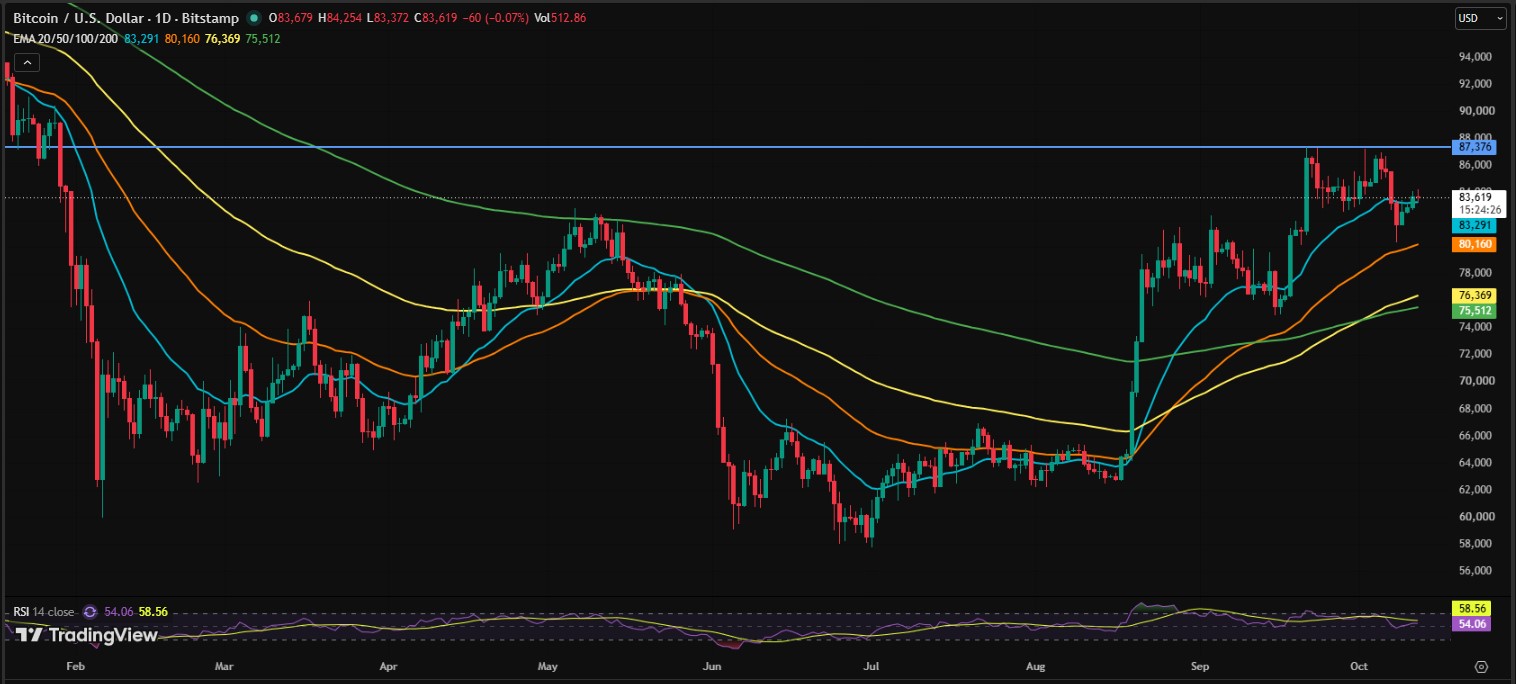
On the weekly chart, analyst Ted noted another close above the 50-week EMA (78,590.56), the 50-week MA (76,618.63), and the May highs. It is the fourth straight weekly candle above the 50-week MA.
The last time that happened, Bitcoin rallied about 3x in a year. Past moves do not promise a repeat.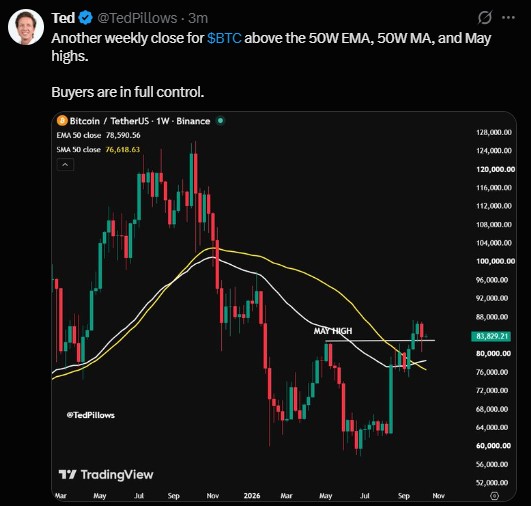
Bitcoin Price Forecast: Which Levels Matter Most?
Price has been stuck under $87,376 for a while. That is about 4.6% above today's level.
Level | Price | Why it matters |
Resistance | $87,376 | Main ceiling on the daily chart |
Upside targets | $90,000, then $92,000 to $95,000 | Possible if a daily close beats resistance |
Support 1 | $83,000 to $82,000 | Near the 20-day EMA at $83,291 |
Support 2 | $80,160 | 50-day EMA |
Support 3 | $76,000 to $75,500 | 100-day EMA (76,369) and 200-day EMA(75,512) |
The bullish case needs a decisive daily close above $87,376. The bearish case is a rejection there, with a drop toward $80,160.
A break below that level would put the $76,000 zone in play.
Is BTC Heading Toward $100K?
One analyst says buyers are stepping in at higher prices and $100K could come next. A short pullback is still possible.
From $83,545, $100K is roughly 19.7% away. That is a long way for one move.
What Do Derivatives Say About BTC Price?
The 24-hour long/short ratio is 1.0751. Longs lead, but only slightly.
Other ratios lean further long. Binance accounts show 1.3321, and OKX shows 1.42. Binance top traders show 1.4125 by accounts and 1.5327 by positions.
Liquidations hit $50.64 million in 24 hours. Shorts lost $42.68 million, while longs lost $7.95 million.
Short-term data is mixed. The last hour saw $811.26K in liquidations, almost all longs. The 4-hour total was $9.35 million, mostly shorts, and the 12-hour total was $14.85 million.
Futures open interest rose 1.67% to $52.45 billion. Options volume rose 114.88% to $1.67 billion, and options open interest is $37.35 billion.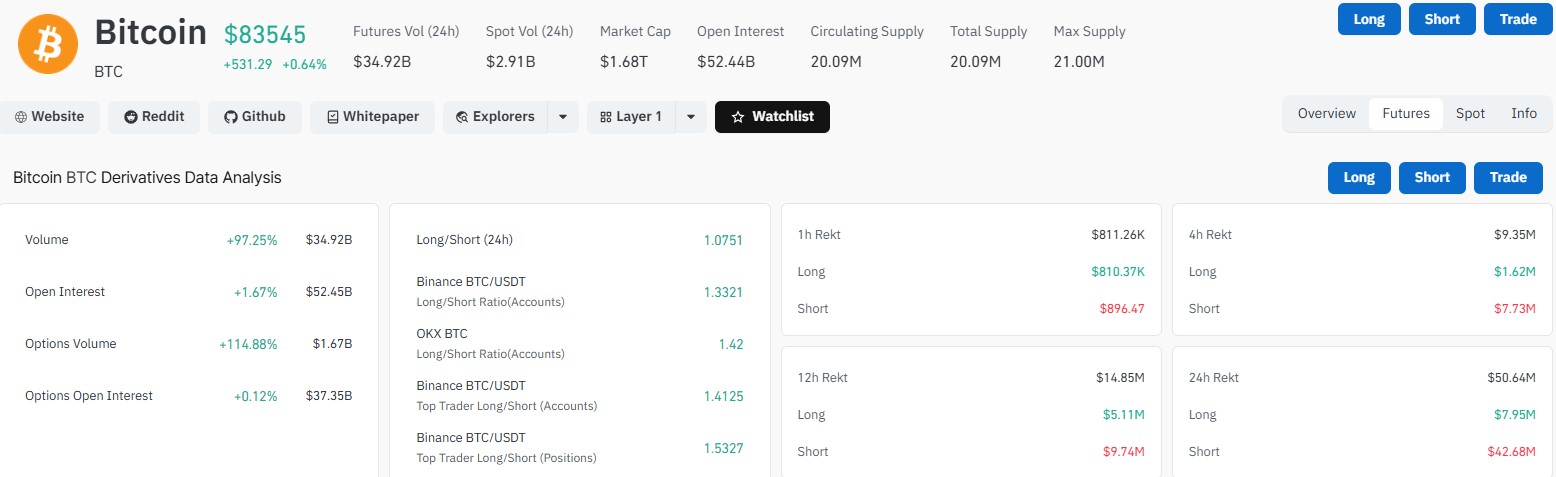
Are Big Buyers Still Adding More BTC?
Michael Saylor posted that there is "always room for more orange." Strategy's tracker shows 848,000 BTC, worth $70.48 billion.
That is one company, not the whole market. Still, it shows demand at current prices.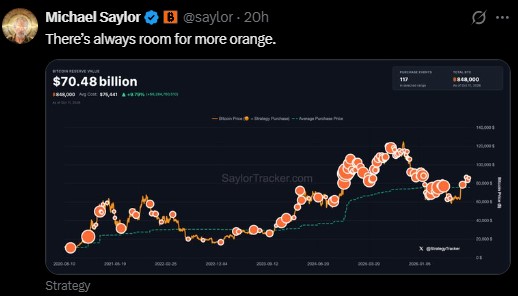
Is October the Bottom for BTC Price?
CryptoQuant says conditions for a bottom are improving ahead of the US midterms. Exchange reserves are still low after a decline that began in late September.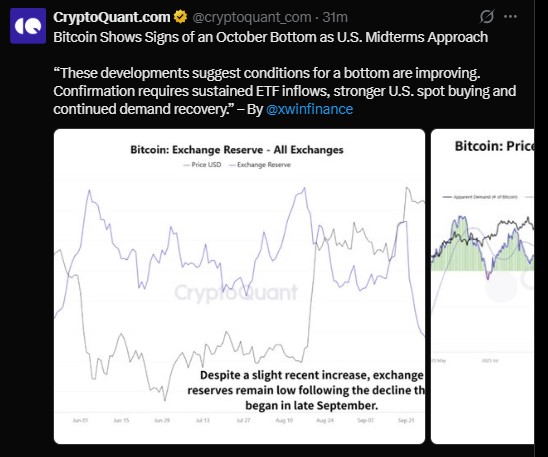
Confirmation needs steady ETF inflows, stronger US spot buying, and a lasting demand recovery.
Crypto Rover also pointed to a "death cross" that marked cycle bottoms before. Chart patterns can fail, so treat it as one data point.
Disclaimer
This article is for information only and is not financial advice. Crypto prices are volatile, and you can lose money. Do your own research and speak with a licensed financial advisor before you invest.

















