Gold Price Prediction: Can China’s Gold Buying Push Gold to $5,000?


Gold price today is trading at $4,175.96 while China's central bank, a post on X says, bought 23 tonnes in September, its biggest monthly buy in three years.
The dollar, interest rates and U.S. oil prices also move gold. This Gold price prediction covers those drivers and the chart levels that matter next.
Gold Outlook: Market Snapshot
Metric | Value |
Price (XAU/USD) | $4,175.96 |
Change | -0.36% |
Gold News Today: China's Central Bank Extends Its Buying Streak
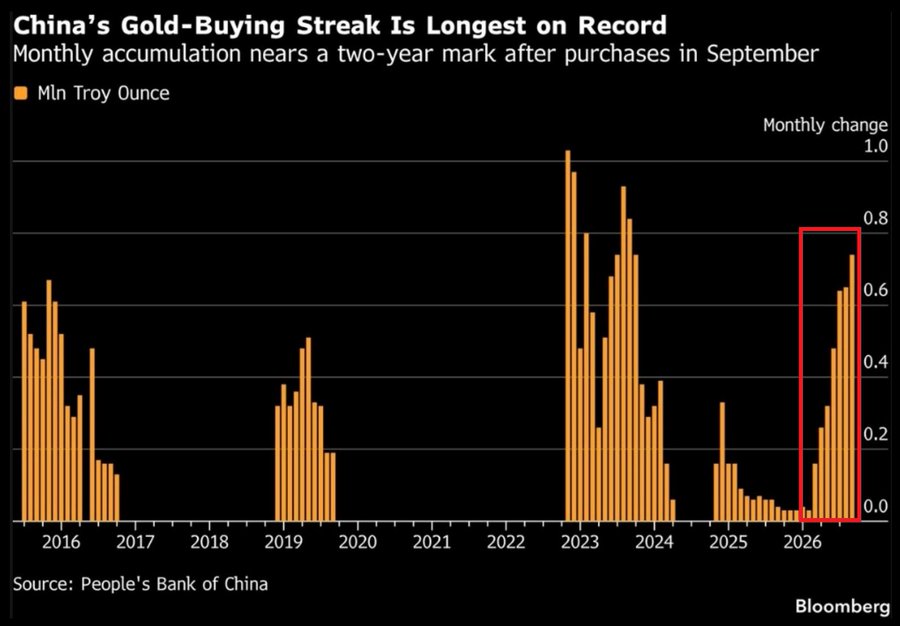
The People's Bank of China bought about 23 tonnes (740,000 ounces) in September, its 23rd straight month. It puts China's 2026 buying at 103 tonnes, second only to Poland, and holdings at a record 2,410 tonnes, about 9% of foreign exchange (FX) reserves.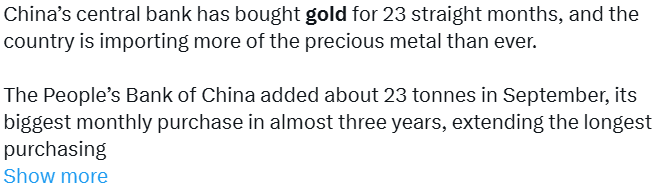
A World Gold Council survey it cites says 45% of 74 central banks plan to buy more gold next year.
Source: Data From X
CoinGabbar's math: 103 tonnes over nine months is about 11.4 tonnes a month, so September ran at roughly twice that pace.
Even so, price is more than 9% below its late-August peak above $4,600. CoinGabbar could not verify the post's figures.
What Moves the Gold Price: Dollar, Rates and Oil
Gold pays no interest and is priced in U.S. dollars, so a few forces matter most.
Driver | When it rises | Usual effect on gold |
U.S. dollar | Gold costs more abroad | Often weighs on gold |
Interest rates | Holding gold costs more | Often weighs on gold |
U.S. oil | Inflation worries can grow | Mixed |
Central bank buying | Demand grows | Often supports gold |
Why Is China Buying 23 Tonnes of Gold?
Spreading reserves. Gold lets a central bank hold less of its reserves in U.S. dollars.
Safety in uncertain times. Many central banks treat gold as a store of value during inflation and market stress.
No counterparty risk. Gold is not another government’s promise to pay, so its value does not depend on one.
How U.S. Oil Prices Affect Gold
U.S. oil here means WTI (West Texas Intermediate), the main U.S. crude benchmark. Higher oil can raise inflation worries, and some investors buy gold as protection against inflation, which can lift gold.
But higher inflation can also lead markets to expect higher interest rates, which can weigh on gold.
XAU/USD Technical Analysis
Gold climbed through August to a peak above $4,600, then fell through September along a downward trendline.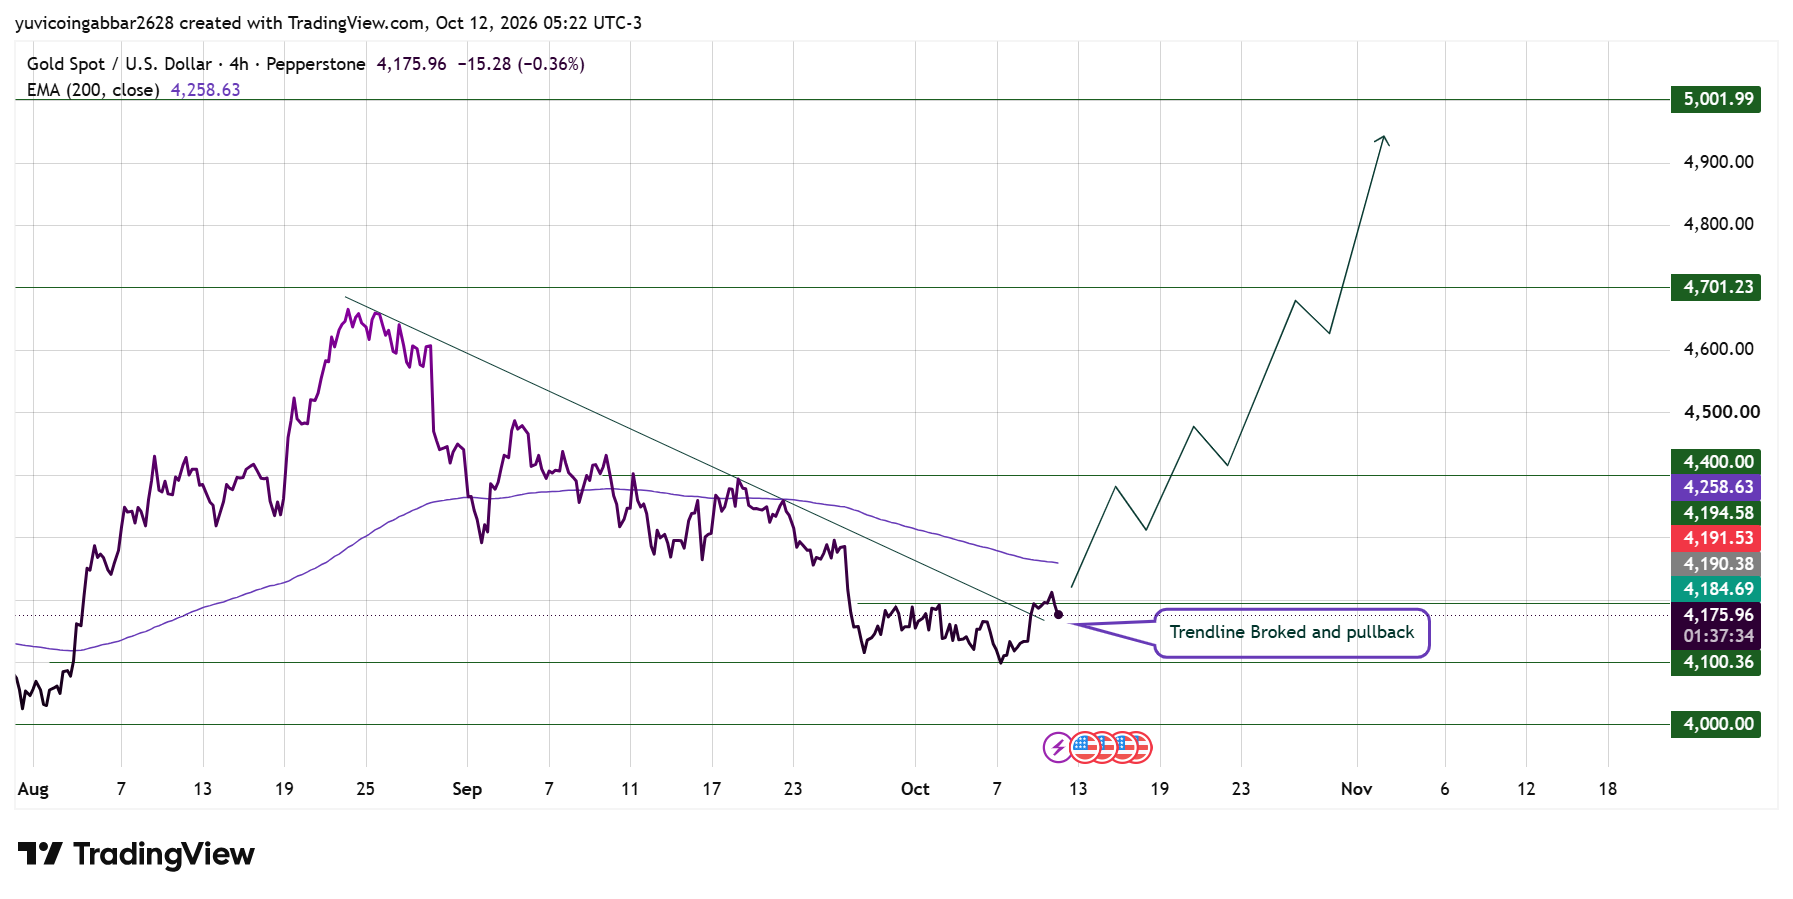
A trendline connects a series of highs. Price found support near $4,100.36 in early October, moved above the trendline, and has pulled back since.
The key point is that for the uptrend to continue, the price should hold above the trendline and maintain support during any pullback.
The risk is that if the price breaks below the trendline, it could enter a consolidation phase or turn bearish before the next rally.
Gold Support and Resistance Levels in This Gold Forecast
Level | Type |
$5,001.99 | Resistance (highest marked) |
$4,701.23 | Resistance |
$4,400.00 | Resistance |
$4,184.69 – $4,194.58 | Resistance zone |
$4,100.36 | Support (first) |
$4,000.00 | Support (deeper) |
Gold Price Forecast: Triggers and Invalidation
Scenario | Trigger | Likely Outcome | Invalidation |
Pullback holds | Closes stay above $4,100.36 | Retest of $4,194.58 | Close below $4,100.36 |
EMA reclaim | Close above $4,258.63 | Move toward $4,400.00 | Close back below $4,258.63 |
Breakdown | Close below $4,100.36 | Slide toward $4,000.00 | Reclaim $4,100.36 |
Gold Price Prediction: Can $Gold Reach $5,000?
$Gold would need to pass $4,258.63, $4,400.00 and $4,701.23 first. A move to $5,001.99 from $4,175.96 is a gain of about 20%, while $4,400.00 is about 5% away.
Gold Price Prediction 2026: Expert View
According to CoinGabbar analysts, The buying data and the chart tell different stories for now. Central banks are adding $gold, while the price still trades below its 200 EMA. A 4H close above $4,258.63 would be the first test of the recovery.
Disclaimer
This article is for informational purposes only and is not financial advice. $Gold prices are volatile. Do your own research before making any trading decisions involving $gold.

















