Bitway Price Prediction: BTW Up 7.81% Against a Falling Market


While Bitcoin and the wider crypto market slide, BTW holds a 7.81% gain.
This Bitway price prediction starts with BTW recovering from a deep slide while Bitcoin falls. Readers following Bitway support levels will find the nearest ones near the price. Sellers rejected the price at $0.6899 on the last attempt.
How Is BTW Holding Up After a 7.81% Daily Rise?
CoinMarketCap market data shows Bitway ($BTW) at $0.6664, up 7.81% over 24h. The token ranks 204th by market cap.
Market cap is $1.94B, up 8.02%. Fully diluted valuation stands at $6.67B.
24h volume is $10.78M, down 22.93%. That's 0.5525% of market cap, so fewer trades backed the rise.
How Is BTW Linked to Bitcoin?
CoinMarketCap Bitcoin data puts BTC at $55,677.47, down 10.04% over 24h.
The project profile describes Bitway as building Bitcoin-focused finance, including loans that use BTC as collateral. BTW is the token for staking, governance, and boosted yields. So Bitcoin activity matters to the ecosystem, yet BTW rose while BTC fell.
| Metric | BTW | BTC |
| 24h change | +7.81% | -10.04% |
| Market cap | $1.94B | $1.11T |
| 24h volume | $10.78M (-22.93%) | $70.64B (+90.05%) |
| FDV | $6.67B | $1.17T |
| Circulating supply | 2.91B of 10B | 20.11M of 21M |
Source: CoinMarketCap,$BTW and BTC snapshots, captured Nov 21, 2026, 06:12 UTC
BTC's market cap is about 572 times BTW's. Heavy trading backed Bitcoin's drop, but the BTW gain came on thinner participation.
BTW's FDV is about 3.4 times its market cap, and tokens yet to circulate could add sell pressure.
What Could BTW Open Interest Change in This Price Analysis?
CoinGlass futures data shows total open interest, the value of all open futures contracts, at $75.99M.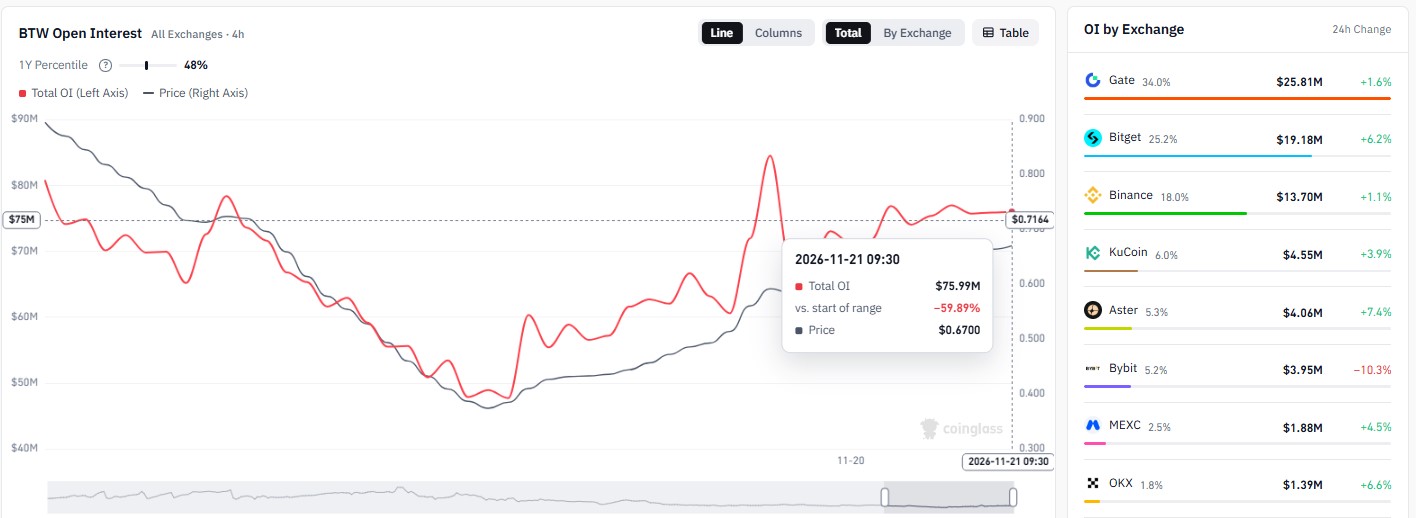
Source: CoinGlass, $BTW open interest, all exchanges, 4H, captured Nov 21, 2026, 06:12 UTC
Two exchanges point in opposite directions. Is that a split in conviction when Bitget's open interest is up 6.2% and Bybit's is down 10.3%? Total open interest of $75.99M seemed heavy next to $10.78M of 24-hour spot volume. at about 3.9% of market cap.
Open interest rebuilt from its earlier trough as price recovered, so traders have been adding positions. Fresh news can shift that positioning quickly. Traders will watch $0.6899 for a breakout and $0.5366 for a breakdown.
Bitway Price Prediction: MACD Levels and Ascending Channel
TradingView's 4H $BTW/USDT chart on HTX frames this Bitway price prediction. Price slid from the top of the chart, then recovered inside an ascending channel, two rising parallel lines that hold price between them. Buyers have held control since the low.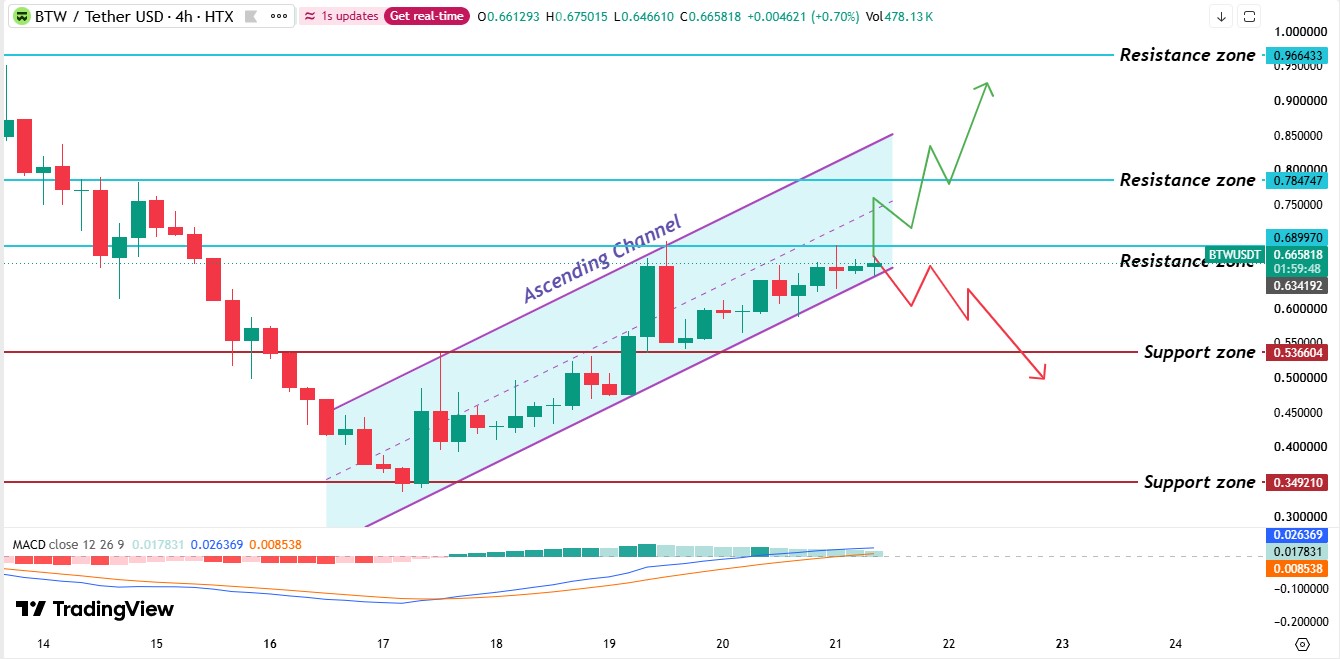
Source: TradingView, BTW/USDT 4H chart with MACD (12, 26, 9) shown, captured Nov 21, 2026, 06:12 UTC
The slide ended near the support level at $0.3492. A spike wick then tagged $0.5366 and was rejected. Buyers later broke above it, and the level flipped from resistance to support. The next push met rejection at the resistance level of $0.6899.
The 4H MACD, short for moving average convergence divergence, reads 0.0264 on the MACD line and 0.0085 on the signal line. Both sit above zero, so buyers hold the edge. The histogram, which plots the gap between them, peaked earlier and has faded since.
The latest candles are small and pressed near the channel's lower edge, a sign of hesitation. A break below that edge would open a move toward $0.5366. A break above $0.6899 would open $0.7847. Traders comparing Bitway price prediction targets can weigh them against this ascending channel. Right now, the price trades just under the $0.6899 resistance level and well above the $0.5366 support level, still inside the channel.
Support and Resistance Levels
| Level | Type |
| $0.9664 | Resistance |
| $0.7847 | Resistance |
| $0.6899 | Resistance |
| $0.5366 | Support |
| $0.3492 | Support |
Bitway Price Forecast: Bull, Base, and Bear Scenarios
Bull: A daily candle above $0.6899 targets $0.7847, then $0.9664, with rising volume as confirmation. A daily candle back below $0.6899 cancels it.
Base: Price remains in a range between $0.5366 support and $0.6899 resistance, moving sideways within the channel. A daily candle breaking either level ends it.
Bear: A daily candle trading below $0.5366 targets $0.3492, with volume expanding on the drop. A daily candle back above $0.5366 cancels it.
Risks to this Bitway price prediction start with Bitcoin, which is down 10.04% over 24h. A deeper slide there could test the $0.5366 support level.
Expert Point of View: Bitway Price Prediction
According to CoinGabbar analysis, the Bitway price prediction tilts cautiously bullish. The 4H MACD sits above zero, and buyers defended $0.5366 after the break. But volume at 0.5525% of market cap and an FDV near 3.4 times the market cap limit conviction.
A daily candle above $0.6899 would turn the setup bullish and open $0.7847. A daily candle below $0.5366 would confirm the bearish case instead.
Disclaimer: This article is for information only and isn't financial advice. Traders should do their own research and risk only what they can afford to lose.