Bitway Price Prediction: Can BTW break the $2.04 Resistance?

Can a top 40 coin lose 16.8% in a week and still hold its ground? That's the question hanging over Bitway (BTW), which trades near $1.70 as of Oct 24, 2026, 10:20 UTC after a spike above $2.60 days back.
This Bitway price prediction builds on the earlier Bitway ATH targets hit story to see which levels still matter. $BTW price sits just above a support zone, and a lot depends on it.
Bitway Market Data Snapshot
Metric | Value |
Price | $1.70 |
7-day change | -16.8% |
Market cap | $2.581B |
FDV | $17.14B |
24h volume | $9.124M |
TVL | $36.484M |
Circulating supply | 1.506B BTW |
Source: Data taken from CoinGlass
FDV sits at $17.14B against a market cap of $2.581B because only about 15% of the 10B supply circulates. The Binance Wallet Earn rally analysis covers earlier context, and total value locked (TVL), the money parked inside the protocol, adds $36.484M.
BTW Price Action Against Bitcoin
BTW price action over seven days is weak, with a 16.8% drop. Bitcoin, per CoinGecko Bitcoin data, slipped 1.5% on the day to $80,500.04.
But Bitway still gained 1.7% on its BTC pair, trading at 0.00002130 BTC. The twist? A coin can sink in USDT terms and edge past Bitcoin when both are weak.
Bitway Holder Concentration Risk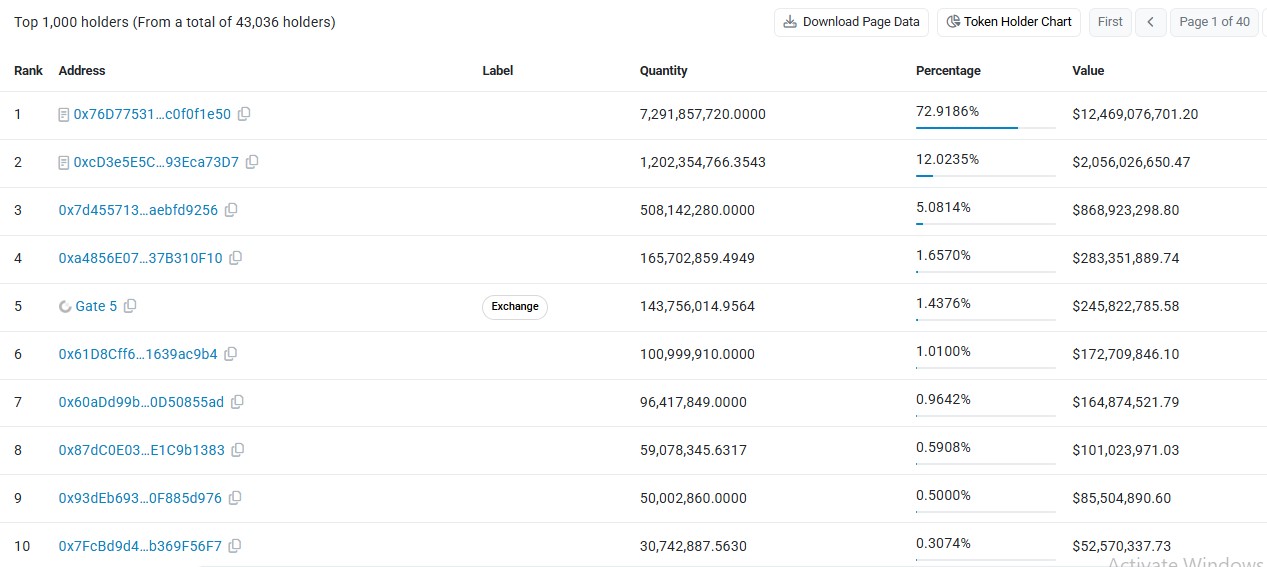
Bitway holder concentration is extreme. Per BscScan holder data, the top 100 of 43,036 holders control 99.90% of supply, and the Gini score reads 0.9983. A Gini score runs from 0 to 1, where 1 means one wallet owns everything.
Whales holders, meaning wallets holding large amounts of supply of the tokens, and BTW whales hold around 99.41% of market cap. And the top two wallets hold 72.9186% and 12.0235% of supply, a combined 84.94% that matches the share of tokens not yet circulating. Much like the unlock risks in other price prediction guides, that hints at locked contracts, not active sellers. But nothing confirms it.
BTW Liquidation Data Snapshot
Shorts sellers took the hit. Traders betting on a drop lost $556.13K in 24 hours, according to CoinGlass liquidation data, while longs lost $301.28K. A BTW liquidation happens when an exchange force-sells a trade built on borrowed money after losses eat the money put up. The pace has slowed fast. Twelve hours: $55.08K. One hour: $3.77K.
Most of the pain landed earlier, probably during the bounce toward $1.86.
BTW Open Interest and Futures Volume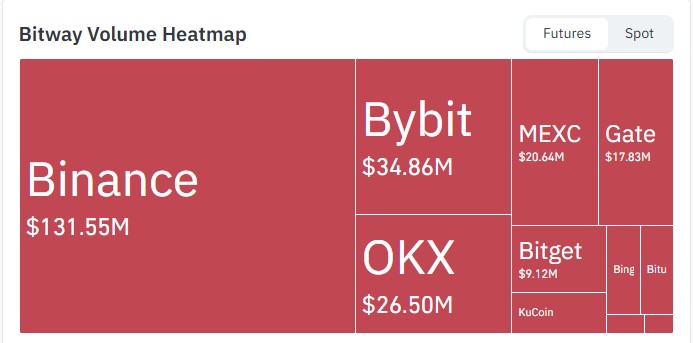
Source: Data taken from CoinGlass
$BTW open interest, the value of futures contracts still open, stands at $190.492M, far above the $9.124M of reported 24h trading volume. Similar setups are tracked in the altcoin analysis archive, while Binance leads the futures heatmap at $131.55M, followed by Bybit at $34.86M and OKX at $26.50M.
BTW Price Prediction: 4-Hour Chart Analysis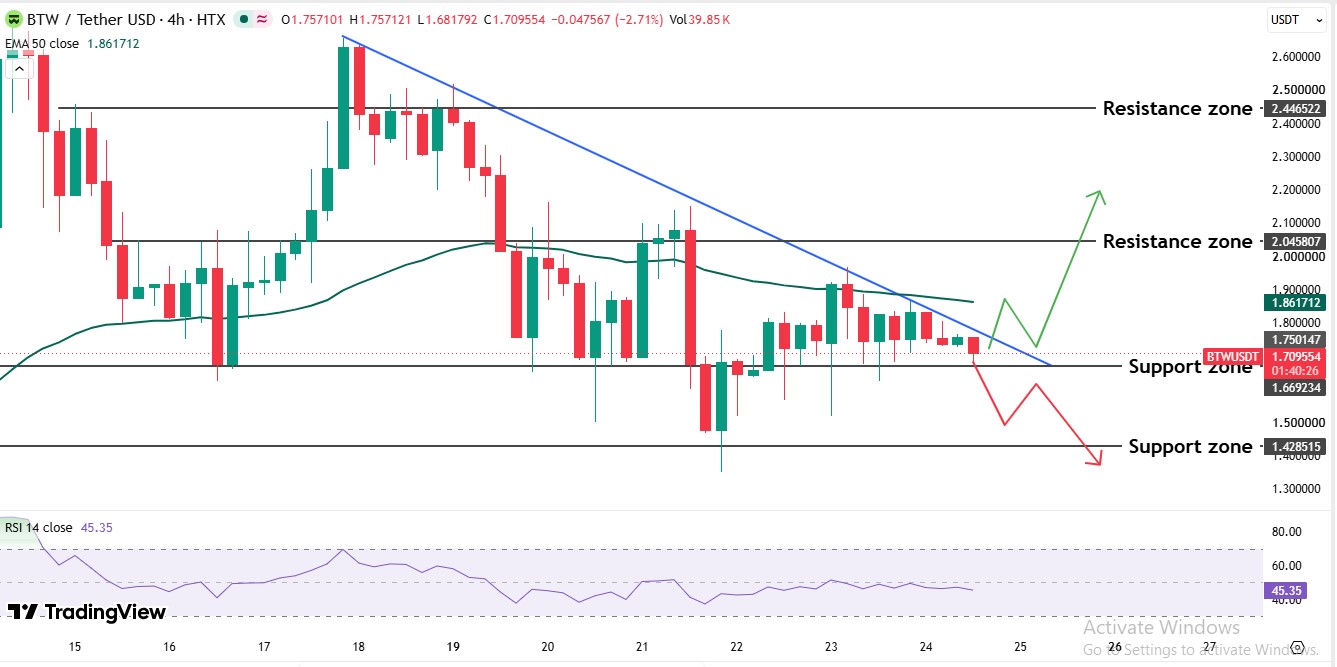
BTW chart analysis on the 4-hour timeframe starts with a sideways range under $2.05 on Oct 16 and 17, 2026. Then came the breakout. Price jumped above $2.60 on Oct 17 and 18, 2026, breaking through the $2.44 resistance.
Shorts got liquidated on the way up, forcing shorts sellers to buy back at higher prices. But the rally didn't hold. Longs got hit next as the price fell back through $2.04 and broke below the $1.42 support on Oct 21, 2026, before buyers stepped in.
Since then, price trades along a falling trendline, a line drawn across lower highs, and keeps failing beneath it. Any fresh catalyst would likely appear in the latest crypto news. Until then, the 50 EMA, an average of recent prices that weighs the newest trades most, sits at $1.86 above price. RSI reads 45.35, under the neutral 50 mark but not at extreme lows.
Bitway Support and Resistance Levels
BTW support and resistance levels work like a floor and a ceiling, with buyers stepping in at support and sellers showing up at resistance. Right now, $1.66 and $1.42 act as floors, while $1.86, $2.045, and $2.44 are ceilings.
Level | Price |
Resistance 2 | $2.44 |
Resistance 1 | $2.045 |
50 EMA | $1.86 |
Support 1 | $1.66 |
Support 2 | $1.42 |
Bitway Price Prediction: Bull, Base, and Bear Scenarios
Scenario | Trigger | Target |
Bull | Trades above $1.86 and the trendline | $2.04, then $2.44 |
Base | Holds $1.66 but fails at $1.86 | Sideways trading |
Bear | Trades below $1.66 | $1.42 |
BTW Price Forecast: Expert Outlook
As per CoinGabbar analysis, the price leans bearish for now. Price trades below the 50 EMA at $1.86 and sits under a falling trendline. This Bitway price prediction stays bearish below $1.86 and turns neutral only above it.
At first, a bounce from $1.66 felt likely, since support is near and sellers have slowed. One more failed push at the trendline would put $1.42 in play, and supply held by a few wallets makes drops sharper than rallies.
Bulls keep one hope. A clean push through $1.86 would change the BTW support and resistance picture fast. And buyers haven't shown that yet.
Disclaimer: This article is for information only and isn't financial advice. Crypto assets are highly volatile, and prices can move sharply in either direction. Readers should do independent research and consider their own risk tolerance before making any decision.

















