Bitway Price Prediction: BTW Hits $2.75 ATH, Can Bulls Target $4?


Can a token that sat at $0.007687 in March really trade near $2.49 in October?
That's the question behind every Bitway price prediction search today, and it's a fair one.
Back on August 4, 2026, around 09:00 UTC, an early breakout forecast flagged $0.2212 as the far target. Price blew past it. So did the next several levels, which changes how every BTW price prediction reads.
Bitway Price Today: Market Data Snapshot
As of October 14, 2026, around 10:30 UTC, CoinMarketCap data lists these BTW readings.
Price: $2.49, up 37.33% in 24 hours
24-hour range: $1.85 to $2.75
Market cap: $7.25B, rank #201
24-hour volume: $147.4M, up 54.34%
Circulating supply: 2.91B of 10B BTW
All-time high: $2.75 on October 14, 2026
Liquidity depth equals just 0.07% of market cap, so big orders can move Bitway price today fast.
Why Is Bitway Moving Today
BTW printed a fresh $2.75 peak on October 14, 2026. Volume jumped 54.34%. Shorts got squeezed. Liquidations reached $3.48M in 24 hours, and $3.20M came from short positions.
Bitrue announced a coming BTW spot listing about 23 hours earlier. Timing matters. But price has slipped 6.29% over four hours, per CoinGlass.
How Earlier $BTW Price Targets Played Out
Quick scorecard first. On August 19, 2026, at 09:40 UTC, BTW traded near $0.596, and the Binance Wallet booster forecast set a seven-day bull range of $0.650 to $0.831.
Its early 2027 bull range topped out at $2.200, and every level in that call now sits below current trading.
And August 4's top target of $0.2212 sits more than 11 times below today's price. August's base case expected consolidation. Buyers disagreed.
BTW Technical Analysis: Daily Chart and EMA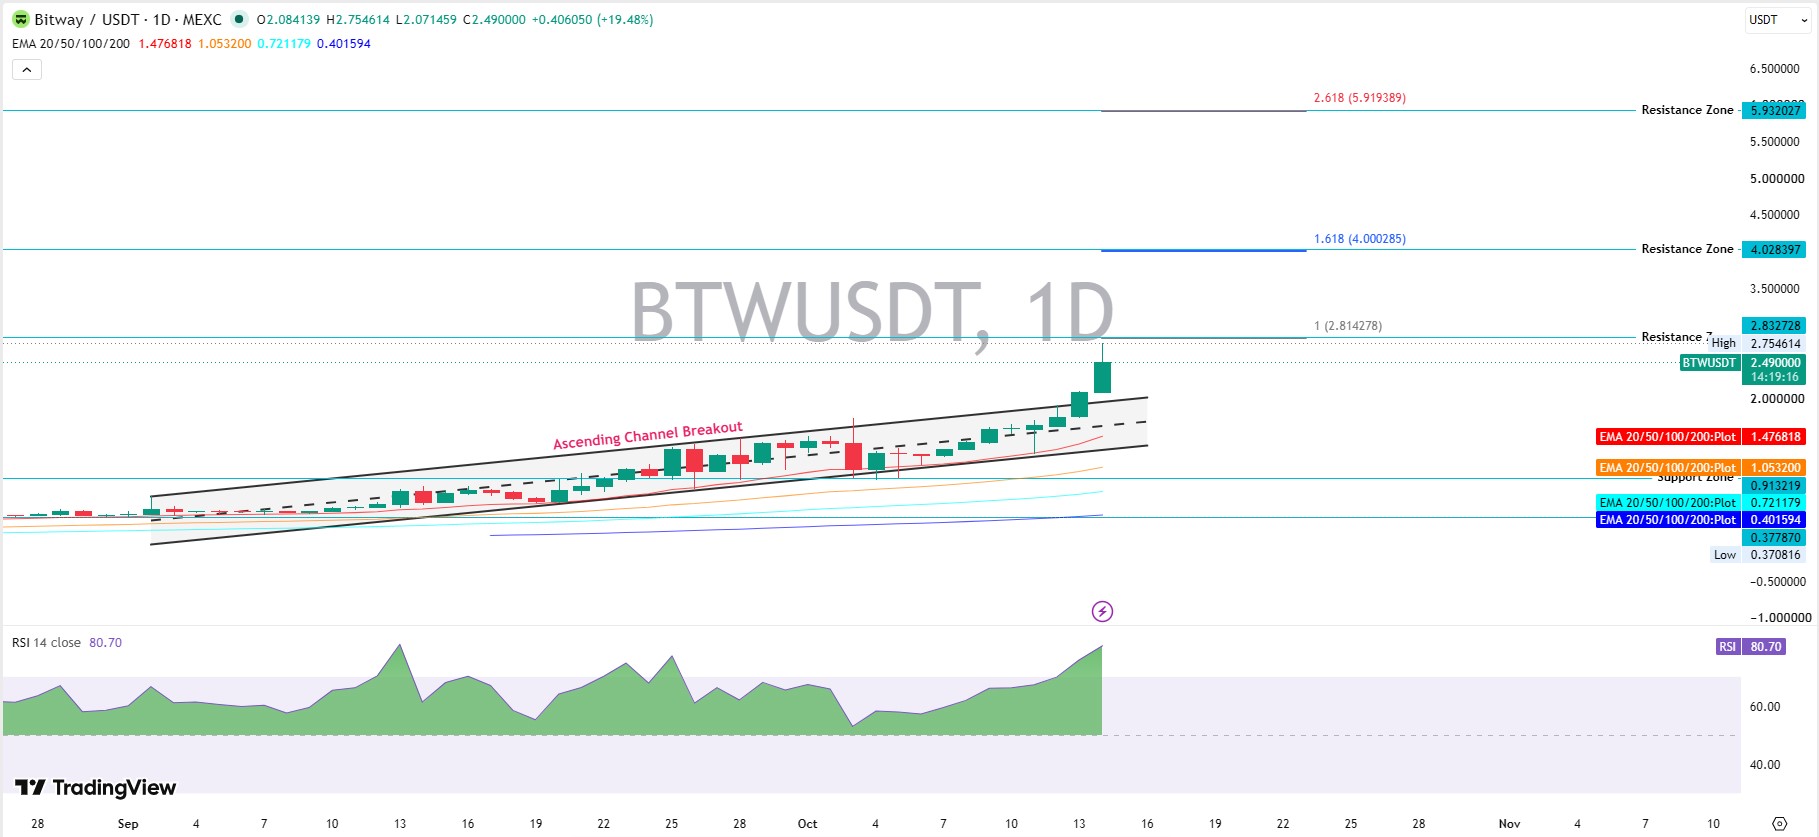
This BTW technical analysis starts with the daily BTW/USDT chart on MEXC. The price broke above an ascending channel, a pair of rising trendlines in place since early September.
Today's daily candle peaked at $2.754614 and trades near $2.49, up 19.48% since its $2.084139 open. EMA, short for exponential moving average, weighs recent trading more heavily.
Readings run $1.476818 for EMA 20, $1.0532 for EMA 50, $0.721179 for EMA 100, and $0.401594 for EMA 200. Stacked in order, they point to an uptrend. But price trades roughly 69% above EMA 20, which is stretched.
RSI at 80.70: Overbought, Not Broken
Daily RSI 14 reads 80.70. That screams pullback. Then again, strong trends can stay overbought for weeks, so calling a top here would be guessing.
Bitway Support Levels to Watch
Nearest support sits at $2.07, today's daily low, then roughly $2.00 near the old channel top. Another level matters too. $1.85, the 24-hour low.
Deeper cushions sit at EMA 20, $1.476818, and EMA 50, $1.0532. Everything now depends on one thing. Whether buyers defend $2.00.
Bitway Resistance Levels and Price Target
Bitway support and resistance mapping gets simpler above $2.75, since no old highs exist there.
A Fibonacci extension, a ratio-based tool that projects targets beyond prior highs, marks resistance at $2.832728, $4.028397, and $5.932027. Readers can weigh each Bitway price target against earlier price target coverage.
Bitway Price Prediction: Bull Case
Under this scenario, a $BTW price forecast of $4.03 could play out if BTW trades above $2.83 with rising volume over 30 days.
Invalidation arrives if trading slips back under $2.00. Futures activity drove earlier BTW rallies, such as the futures listing surge.
Bitway Price Forecast: Base Case
A neutral $BTW price prediction for seven days sits between $2.00 and $2.83, unless fresh exchange listings add buyers. Short-term bias stays cautious.
Bitway Price Prediction: Bear Case
If BTW loses $2.00 and then $1.85, a slide toward EMA 20 at $1.476818 could follow.
And deeper trouble points to EMA 50 at $1.0532, roughly 58% below $2.49. Squeeze-driven rallies can unwind fast, a pattern covered in short squeeze coverage.
Can Bitway Reach $4 From Here?
Can $BTW reach $4? Math says a gain of roughly 61%, while $5.93 needs about 138%. But volume would need to expand, since daily volume equals just 2.03% of market cap. Dates matter too, so a coin events calendar helps track upcoming catalysts.
Derivatives Data: Liquidations and Open Interest
CoinGlass data shows futures volume at $812.80M against $112.99M in spot, roughly seven times higher. Open interest, the value of open futures contracts, reads $352.41M.
The Binance account ratio sits at 0.3335. Meaning, more short accounts than long. But top trader positions read 1.7313, which leans long. Crowd and large traders disagree.
Holder Concentration on BscScan
BscScan holder data shows the top wallet holds 72.9186% of the supply, with the next two at 12.0235% and 5.0814%. The top 10 wallets hold 96.04%, the whale concentration reads 99.94%, and the Gini score, a 0 to 1 inequality gauge, sits at 0.9999.
That top wallet isn't tagged as an exchange, so its purpose stays unconfirmed. What happens if one of those wallets starts moving supply?
Reward Campaigns as a Catalyst
A Binance Wallet booster campaign lined up with the August jump. Fresh crypto airdrops and campaigns could repeat that pull.
Risks That Could Change the Bitway Price Prediction
Thin liquidity tops the list. Supply concentration comes second, and overbought RSI third. Bitcoin direction also sets altcoin mood, so the Bitcoin price prediction belongs on the same watchlist.
Final Takeaway
Trends favor buyers. Positioning favors caution. Buyers cleared every earlier target, and $2.00 now decides whether $4.03 stays reachable.
This $BTW price prediction 2026 outlook hinges on that one level, and more crypto coverage lives in the price prediction hub.
Disclaimer: This article is for informational purposes only and isn't financial advice. Crypto prices are highly volatile, scenarios aren't guarantees, and data can change quickly. Always research independently before trading.

















