Canton Price Prediction: Can CC Hold $0.08935 Support?


Will CC hold above $0.08935 or slide toward $0.07343 next?
This Canton price prediction starts with a coin trading 1.7% above its nearest support level. Canton (CC) is the token of a blockchain built around privacy, and Canton CC privacy and utility cover the design. CoinGecko data and an OKX daily chart, captured Nov 12, 2026 at 04:30 UTC, set every level below.
Canton Network 24-Hour Market Snapshot
CoinGecko market data, captured Nov 12, 2026, at 04:30 UTC, puts CC at $0.09095 with a $3.638B market cap.
Metric | Value |
Price | $0.09095 |
24h range | $0.08933 to $0.09451 |
7-day change | -12.4% |
Market cap | $3.638B |
FDV | $3.638B |
24h trading volume | $11.41M |
Source: CoinGecko, CC price, market cap, and FDV, Nov 12, 2026, 04:30 UTC
Canton Network News From the Official X Post
A settled transaction is one the network has finished and recorded. Per the official Canton Network X post, Canton settled 5.6M transactions last week.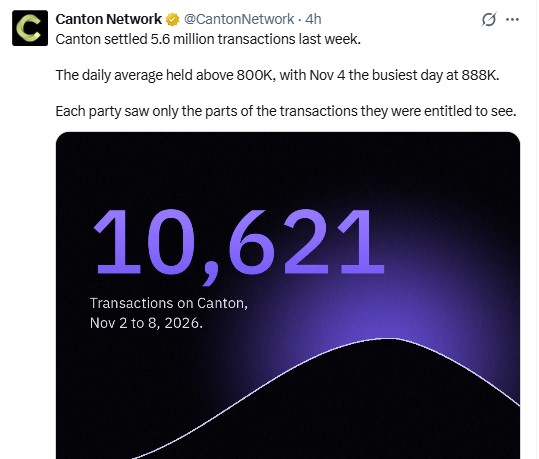
Source: Canton Network official X post, Nov 2 to 8, 2026 activity, captured Nov 12, 2026, 04:30 UTC
The post says the daily average held above 800K. Nov 4 was the busiest day at 888K.
If that pace holds, buyers get a usage argument to pair with a move above $0.10354. If it fades, the argument weakens. The post says nothing about CC demand, so the price still has to confirm it.
Canton Network News Check With CantonScan Data
CantonScan data, captured Nov 12, 2026, at 04:30 UTC, shows 28,350 active addresses in a day, down 17.25%.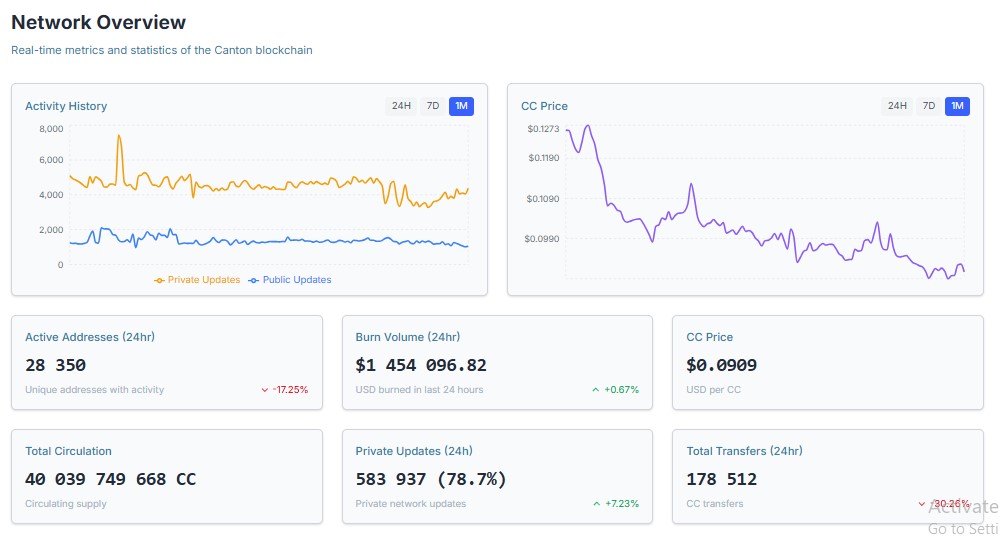
Source: CantonScan, Network Overview, 24h data, Nov 12, 2026, 04:30 UTC
Total transfers reached 178,512, down 30.26%. Burn volume, the USD value of CC destroyed in a day, hit $1,454,096.82, up 0.67%.
Canton Price Performance Against Support Levels
CoinGecko shows CC down 12.4% over seven days, about $0.0129 in price. The 24h range runs from $0.08933 to $0.09451.
Price sits 1.7% above that low. It sits 3.9% below the high. Support is a price area where buyers have stepped in before. The low landed within $0.00002 of the $0.08935 support zone.
Canton’s Open Interest and Futures Volume Across Exchanges
Open interest is the total value of futures contracts still open. CoinGlass data, captured Nov 12, 2026 at 04:30 UTC, shows $40.06M across exchanges.
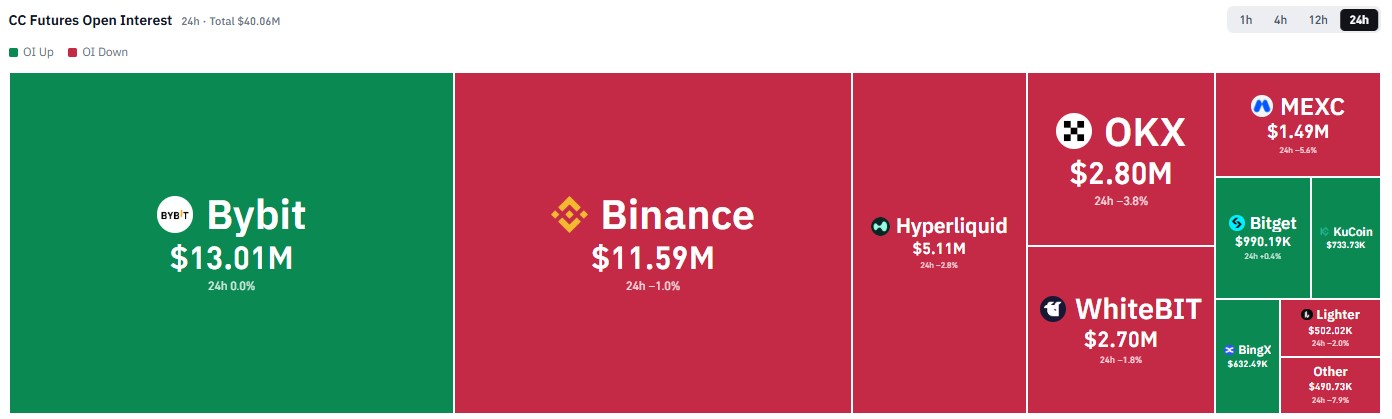
Source: CoinGlass, $CC futures open interest, 24h, Nov 12, 2026, 04:30 UTC.
Bybit holds $13.01M of open interest, and Binance holds $11.59M. Hyperliquid holds $5.11M, and OKX holds $2.80M. Most exchanges posted lower open interest over 24h, including MEXC at -5.6% and OKX at -3.8%.
Futures volume totaled $17.99M over 24h. Binance traded $6.45M, and Bybit traded $3.45M. OKX traded $2.15M, and Hyperliquid traded $2.13M.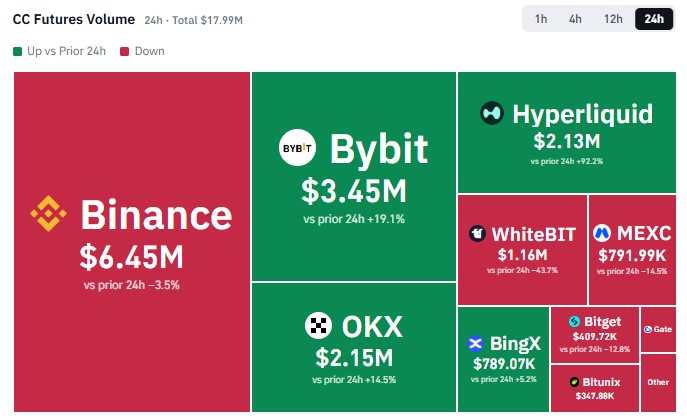
Source: CoinGlass, $CC futures volume, 24h, Nov 12, 2026, 04:30 UTC
Hyperliquid volume jumped 92.2% while its open interest slipped 2.8%. That gap fits quick in-and-out trades, not fresh positions.
Canton Price Prediction: Technical Analysis 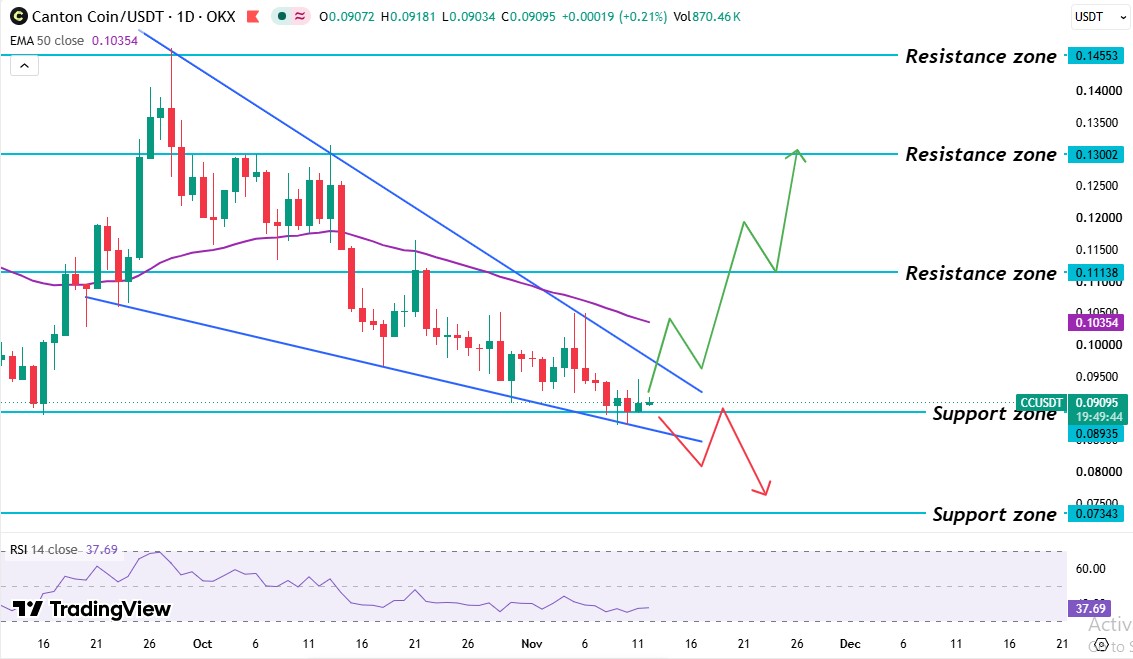
Source: TradingView, $CC/USDT 1D, EMA 50, and RSI 14, November 12, 2026, 04:30 UTC
The OKX 1D chart for CC/USDT on TradingView, captured Nov 12, 2026, 04:30 UTC, frames this Canton price prediction. A sharp late-September rally spiked to the $0.14553 level before sellers took control.
After the peak, the price chopped between the $0.11138 and $0.13002 resistance levels, areas where sellers have defended before. In mid-October, buyers hit the upper trendline and failed. Price then fell through the 50-day EMA. A falling wedge, two downward lines that squeeze together, has framed every bounce.
The earlier November forecast gives the prior setup for comparison. The market tried many times to break the upper trendline of the wedge, but sellers defended it. The $0.08935 support zone, where buyers have stepped in, still holds.
The $0.10354 50-day EMA, where sellers have capped rallies, sits above. Right now, the price trades just above that support, under the falling trendline of the wedge and the 50EMA.
The CC 50-day EMA sits at $0.10354. CC's $0.09095 price trades 12.2% below it, and the latest daily candle trades below it too, and the falling trendline sits near it, so a real recovery needs both.
The CC RSI reads 37.69 on the 14-day setting. A reading under 50 means sellers hold the momentum edge. And a reading above 30 means oversold conditions haven't formed, so the price has room to fall.
Canton Support Levels and Resistance Levels
Level | Role |
$0.07343 | Support |
$0.08935 | Support |
$0.10354 | 50-day EMA |
$0.11138 | Resistance |
$0.13002 | Resistance |
$0.14553 | Resistance |
Canton Network: Bull, Base, and Bear Scenarios
Scenario | Trigger | Target | Invalidation |
Bull | Candle trades above the $0.10354 EMA level | $0.11138, $0.13002, then $0.14553 | Candle trades back below $0.10354. |
Base | Price holds between $0.08935 and the 50 EMA level. | Range Trade | Candle trades outside either level |
Bear | Candle trades below $0.08935. | $0.07343 | Candle trades back above $0.08935. |
The base case for this Canton price prediction fits the wedge, with $0.08935 and $0.10354 as its edges. Bulls need to break the trendline and the 50EMA level
Risks are plain. A usage fade would weaken the 800K daily average argument. A derivative unwind could hit price if open interest slides. And a candle trading below $0.08935 invalidates the base case.
Expert Outlook for the Canton Price Forecast
According to CoinGabbar analysis, the stance on this Canton price prediction stays bearish below the 50 EMA level. RSI at 37.69 shows weak momentum. Active addresses fell 17.25%.
But 5.6M weekly settlements keep the usage case alive, and the Uber pilot and HSBC deposits add wider network context. The first real bull signal is a daily candle trading above $0.10354 with active addresses rising back above 28,350.
Disclaimer: This article is for information only and isn't financial advice. Traders should do their own research and risk only what they can afford to lose.