Cardano Price Prediction: Is the ADA Channel Real or a Trap?

Is Cardano quietly building a staircase while traders argue about the floor?
ADA has been climbing since the last Cardano forecast flagged a messy long flush. But climbing and holding aren't the same.
Buyers keep showing up, and a new chart shape appeared. Whether this Cardano price prediction holds up depends on a few levels and one stubborn ceiling.
Market Snapshot: Where ADA Stands Now
Metric | Value |
Price | $0.2248 |
24H change | +4.31% |
24H range | $0.2147 to $0.2258 |
Market cap | $8.27B |
24H volume | $277.42M (+28.3%) |
As per CoinMarketCap data, October 21, 2026, 09:20 UTC.
Cardano price today is up 4.31%, but volume grew faster at 28.3%. That's participation, not a thin squeeze.
Latest Previous Prediction: Target vs. Actual Result
Window: October 19, 2026, 09:10 UTC to October 21, 2026, 09:20 UTC.
Scenario | Target | Actual | Status |
Bull | Trade above $0.2238, aim $0.2265 | Reclaimed $0.2238, 24H high $0.2258 | Partially Hit |
Base | Range $0.2199 to $0.2231 | Price at $0.2248, above range | Not Hit |
Bear | Lose $0.2199, aim $0.2112 | 24H low $0.2147, $0.2112 untouched | Partially Hit |
Bulls won this round. The previous Cardano price prediction leaned bearish below $0.2238, and the price reclaimed it. That wall first showed up in the earlier 200 EMA setup.
Why Is Cardano Moving Today?
ADA is up. Volume jumped 28.3%. Buyers pushed through $0.2238. Then $0.2248. Spot inflows turned green. Steady buying did.
Cardano News Today: Hydra Workshop Goes Live
Dev Office Hours put the Hydra team on stage for use cases, per the official Cardano X post. Hydra is Cardano's layer-2 scaling tool, a system that handles activity off the main chain.
Fees can be set down to zero inside a head, a Hydra mini-ledger. Builder news, not a price trigger. But developer attention often arrives before users do.
Cardano Ecosystem Activity: Research and App Tracking
The Cardano Research Exchange launched as a live series, with two more sessions on staking incentives.
Separately, 21 of 103 apps on cardano.org have transaction tracking on, per the latest Cardano X update. Roughly a fifth. And each enabled app joins a leaderboard.
Cardano Technical Analysis: The Ascending Channel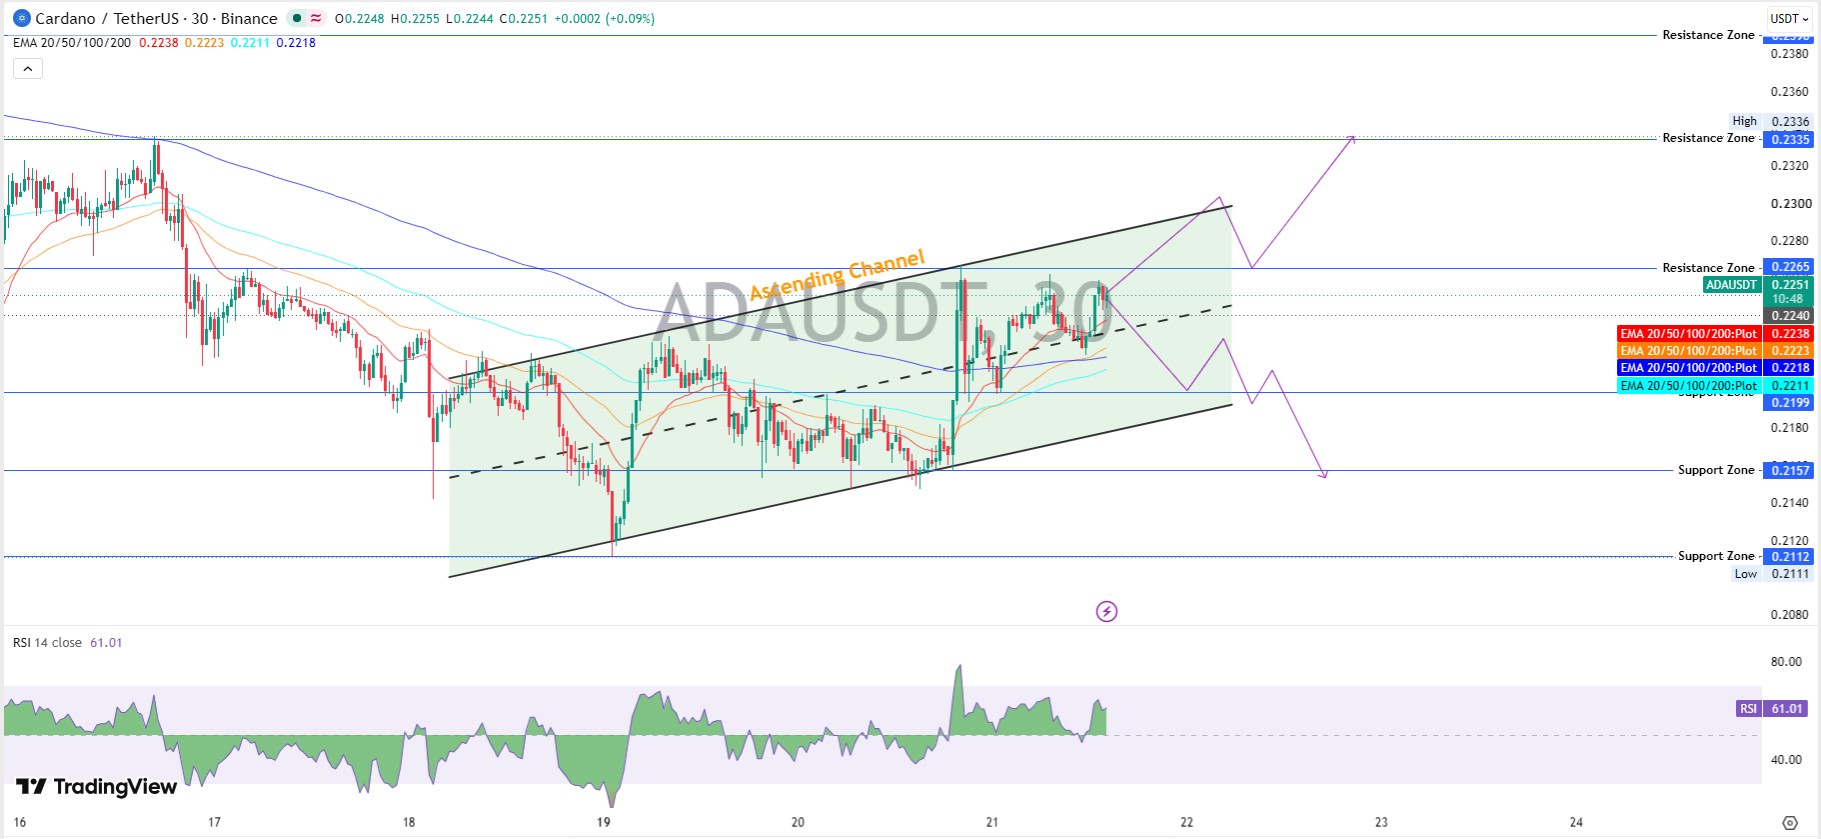
This Cardano technical analysis uses the TradingView ADA chart for Binance ADA/USDT on the 30-minute timeframe.
Earlier this week, ADA slid through a falling lane. Now it trades inside an ADA ascending channel, a rising lane of higher lows and higher highs.
RSI, a momentum gauge running from 0 to 100, reads 61.01. Readings over 50 favor buyers, while a push toward
70 would warn of overheating.
EMAs are moving averages that weigh recent trades more heavily. The 20 EMA, 50 EMA, 100 EMA, and 200 EMA sit between $0.2211 and $0.2238, and the price trades above every one. The dashed midline near $0.2240 works as a pivot.
Key Support Levels
Support is a zone where buyers stepped in before. $0.2199 comes first, sitting right on the projected lower rail. Then $0.2157, then $0.2112.
A hold above the midline keeps the climb alive, a pattern covered in the midline retest analysis.
Key Resistance Levels
Resistance is where sellers tend to appear. $0.2265 capped the last spike. Next comes $0.2335, near the recent swing high of $0.2336. That completes the $ADA support and resistance map.
ADA Futures Data: Longs Outnumber Shorts
CoinGlass ADA data shows futures volume at $417.93M and open interest, the total value of open contracts, at $474.58M. Spot volume reads only $53.34M.
Futures trade nearly eight times the spot volume. And Binance accounts run a long/short ratio of 1.8629. That's crowded. If the channel snaps, who sells into that crowd first?
Liquidations and Exchange Volume
Liquidations, forced exits when margin runs out, hit $698.70K in 24 hours. Shorts lost $359.50K and longs $339.20K, so it's chop with two losers.
Binance leads futures volume at $146.87M. Liquidity shifts fast, and exchange listing updates show where it may travel next.
Spot Flows: Are Buyers Real?
Spot net inflows read +90.53K over 15 minutes and +89.05K over 30 minutes. Small money. But spot leads, and futures follow.
Binance-Peg $ADA Holders: Who Holds the Supply?
BscScan holder data tracks Binance-Peg ADA, the BNB Chain version of the coin, with 616,510 holders.
Yet 53 whale wallets control 71.66%. Binance Hot Wallet 20 alone holds 23.54%. That's exchange inventory, not proven conviction.
Cardano Price Prediction: Bull, Base, and Bear Scenarios
This Cardano price prediction leans bullish while ADA trades above $0.2218, the 200 EMA. Below $0.2199, that lean flips.
Calling it a breakout felt right for a second. Actually, no: price still sits under $0.2265, so it's a staircase.
Scenario | Trigger | Targets | Invalidation | Timeframe | Liquidity condition |
Bull | Trades above $0.2265 | $0.2335 | Trades below $0.2199 | 2 to 5 days | Volume holds above $277.42M, spot inflows positive |
Base | Trades between $0.2218 and $0.2265 | Range chop | Break of either side | 24 to 72 hours | Volume fades, flows mixed |
Bear | Trades below $0.2199 | $0.2157, then $0.2112 | Trades above $0.2240 | 1 to 4 days | Long liquidations rise, volume expands |
The first $ADA price target sits at $0.2335 on trades above $0.2265. Losing $0.2199 opens $0.2157 first, then $0.2112.
Cardano Price Prediction 2026: Year-End View
ADA is down 32.46% year to date and 66.09% over one year. But it's up 29.04% over 90 days.
A year-end Cardano price forecast hinges on trades above $0.2335, with $0.2112 as the line bulls can't lose. The Starknet September forecast maps another altcoin's monthly levels.
Supply Check: Does Dilution Matter?
Circulating supply is 36.81B ADA against a 45B maximum, about 82%. FDV, the market cap if every coin existed today, reads $10.11B.
Token cliffs like the Starknet unlock event can swing charts overnight. Nothing in the data points to one here.
Risks That Could Change the Cardano Price Prediction
Crowded longs, thin spot volume, and a rejection at $0.2265. That mix could flip the setup.
And attention rotating toward themes in AI crypto news can drain flows from altcoins like $ADA.
Final Takeaway
Bias stays bullish above $0.2199, with $0.2265 as the gate. A rejection there makes the channel a trap. More setups sit in crypto price predictions.
Disclaimer: This article is for information only and isn't financial, investment, or tax advice. Crypto is volatile, and losses can be total. Price predictions are opinions based on market data and can't guarantee future results. Research independently and consult a licensed advisor before investing.