Ethereum Open Interest Fell 25% in a Month: Is Something Big Coming?


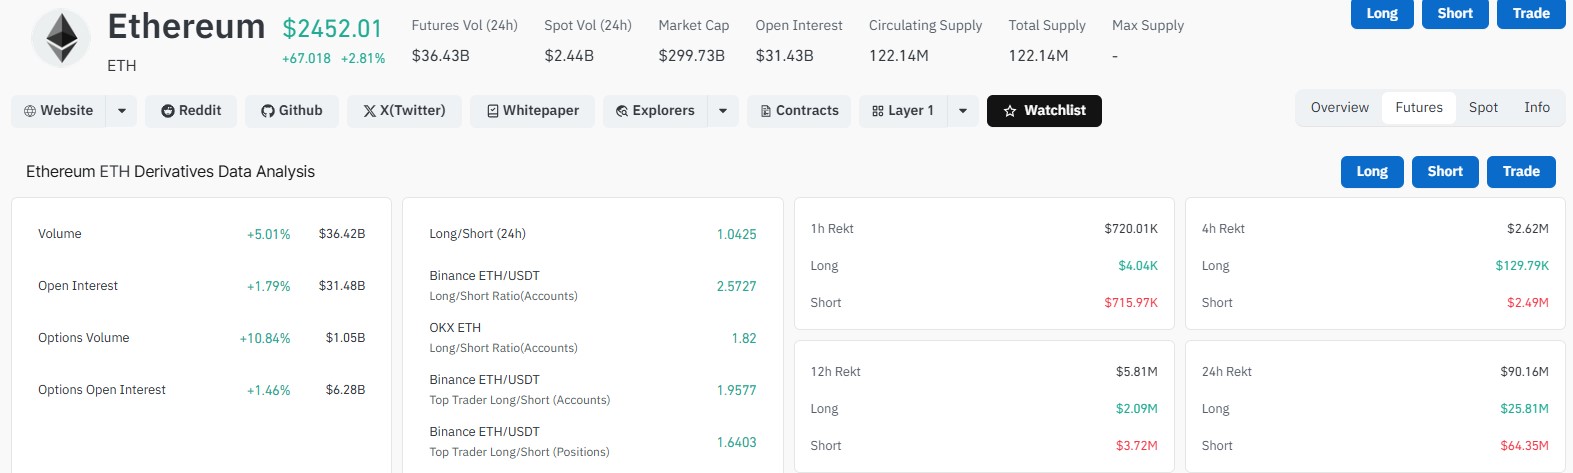
Ethereum is trading near $2,452 today, up 2.81% in 24 hours. That is a gain of about $67.
But the bounce looks weak. ETH needs to climb back above $2,550 to calm fears of another sharp drop. Until then, the risk stays on the table.
What Is the Current $ETH Price?
The altcoin jumped from the $1,900 range to above $2,300 in a mid-August breakout. It then rallied to a high near $2,800 in September and was rejected. Since early October, it has pulled back hard.
Metric | Value |
Price | $2,452.01 |
24-hour change | +2.81% (+$67.02) |
Market cap | $299.73 billion |
24-hour futures volume | $36.43 billion |
24-hour spot volume | $2.44 billion |
Futures open interest | About $31.4 billion |
Options volume | $1.05 billion (+10.84%) |
Options open interest | $6.28 billion (+1.46%) |
Circulating supply | 122.14 million ETH |
Why Is Ethereum Open Interest Dropping?
Traders are stepping back, and ETF money is leaving.
CryptoQuant shows ETH open interest fell from about $16 billion to $11.881 billion. That is a drop of $4.119 billion, or 25.74%, in under a month. The peak came around late September.
On Binance, it slipped from about $6.855 billion to $5.839 billion. Fewer open bets usually means less fuel for a rally.
Trackers count open interest differently, so this is lower than the $31.4 billion in the table.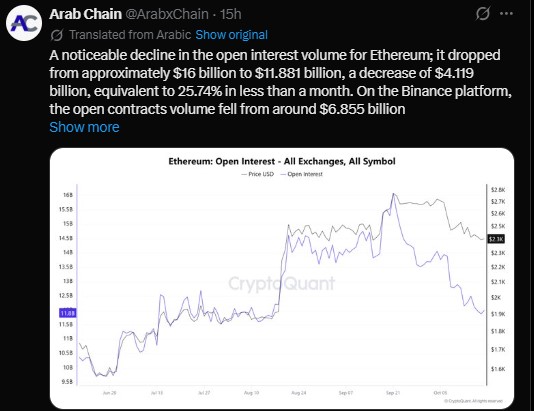
Are Ethereum ETFs Seeing Outflows?
Yes. SoSoValue data shows US spot ETH ETFs had a net outflow of $26.13 million yesterday.
It was the fifth day in a row of net outflows.
Is $ETH Bullish or Bearish Right Now?
Derivatives data leans slightly bullish. The overall 24-hour long/short ratio is 1.0425.
Long/Short Ratio | Reading |
Overall (24 hours) | 1.0425 |
Binance ETH/USDT (accounts) | 2.5727 |
OKX ETH (accounts) | 1.82 |
Binance top traders (accounts) | 1.9577 |
Binance top traders (positions) | 1.6403 |
Liquidations were small. Shorts took the bigger hit, which fits the bounce.
Window | Total | Longs | Shorts |
1 hour | $720.01K | $4.04K | $715.97K |
4 hours | $2.62M | $129.79K | $2.49M |
12 hours | $5.81M | $2.09M | $3.72M |
24 hours | $90.16M | $25.81M | $64.35M |
Is Ethereum Following the Russell 2000?
Analyst Ash Crypto thinks it could. The Russell 2000 has led ETH for years, and the gap is now the widest ever.
The October 10 crash broke that link. Crypto slid into its own bear market, while the Russell hit a new all-time high.
His chart marks a breakout and retest on the Russell. It is now about 11% below its high and just bounced 1.67% from key support.
If it keeps rising, $ETH could follow. He lists $2,800 as first resistance, then $3,600 to $4,500 if that breaks.
This is one view, not a promise. Earnings, oil prices, inflation, ISM data, and the US midterms may add swings.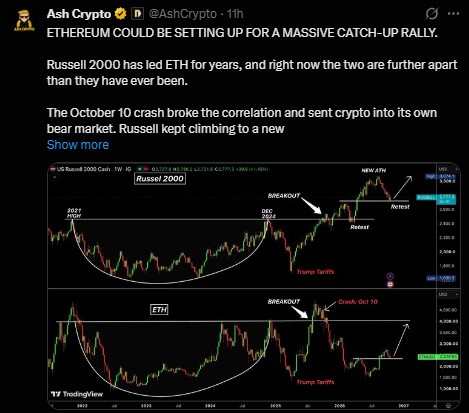
What Is the ETH Support Level?
The daily chart shows stacked support. A demand zone, two moving averages, and a trendline from the July low near $1,520 all meet here.
Level | Type | Why It Matters |
$2,800 | Resistance | September swing high |
$2,700 / $2,600 | Resistance | Targets if bulls take control |
$2,550 | Resistance | Reclaim eases correction risk |
$2,500 | Resistance | Close above clears 20 and 50 EMAs |
$2,495 | 20 EMA | Sloping down, capping rallies |
$2,480 | 50 EMA | Sloping down, capping rallies |
$2,363 | 100 EMA | Inside the demand zone |
$2,330 to $2,370 | Support | Held several times, including mid-October |
$2,316 | 200 EMA | Sits near the trendline |
The RSI is 43.47, which is neutral to weak. Momentum has cooled, but $ETH is not oversold.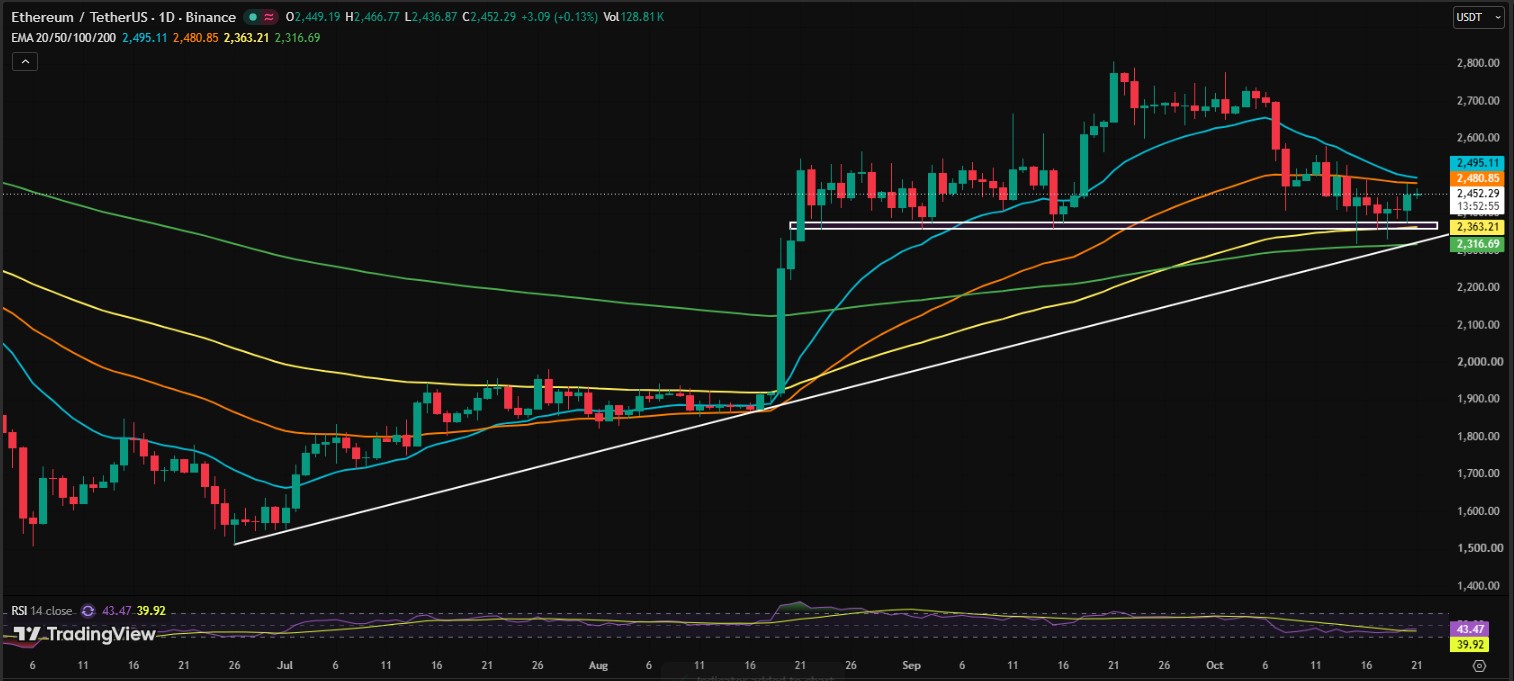
Can ETH Reach $2,800?
Bullish case. ETH holds $2,330 to $2,370 and closes a daily candle above $2,500. That clears the 20 and 50 EMAs.
It could then open the way to $2,600 and $2,700. A retest of the $2,800 high would be the extended target.
Can Ethereum fall to $2,100?
Bearish case. A daily close below $2,300 would break the horizontal support, the 200 EMA, and the trendline together.
That would hurt the bullish setup. A deeper drop toward $2,100 could follow, then the $1,900 breakout base.
Will Ethereum Go Up or Down Next?
Nobody knows for sure. The bias is cautiously bullish while support holds.
Lower wicks near support show buyers absorbing selling. Yet falling open interest and ETF outflows keep Ethereum on a careful footing.
The range is tightening, which often comes before a bigger move. The direction is still unclear.
Watch $2,500 on the upside and $2,300 on the downside.
Disclaimer
This article is for information only. It is not financial, investment or trading advice. Crypto prices are very volatile, and you can lose some or all of your money. Price levels and forecasts are opinions, not promises. Always do your own research and speak to a licensed financial advisor before you invest.