Chainlink Price Prediction: Is $9 a Floor After the Long Flush?


Can LINK hold above $9 after a flush that wiped out $9.20M in long positions?
Buyers lifted price back to $9.27 on the 1-hour chart, and that's where this Chainlink price prediction starts. LINK dropped to $8.57 first, far below the levels from the earlier channel breakout.
Chainlink Price Prediction Data Snapshot
A Chainlink price projection needs live numbers first, and CoinMarketCap data has LINK at $9.23, down 4.07% in 24 hours and ranked 14th. The daily range ran from $8.63 to $9.65.
Market cap is $6.91B, with 748.09M LINK circulating out of a 1B max supply.
Volume jumped 70.86% to $468.6M, which is 6.79% of market cap, changing hands in a single day.
Price sits 82.57% under the $52.88 all-time high from 2021.
Chainlink Price Analysis of the 1-Hour Descending Channel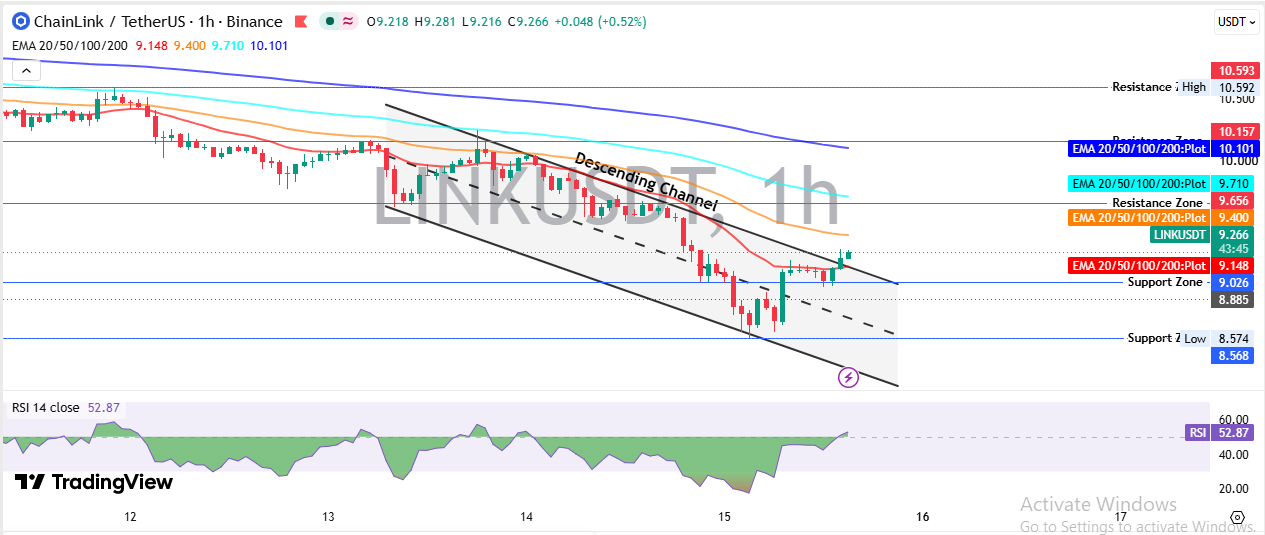
The price started this chart near $10.59 around Nov 12, the highest print on screen. That's resistance, a ceiling where sellers have stepped in before.
A bounce on Nov 13 ran into the upper edge of a descending channel, two falling trendlines that guide price lower, and stalled near $10.16.
By Nov 14, sellers had pushed LINK under $9.656 and then under the 50 EMA near $9.400. EMAs are moving averages that weight recent candles more, and the 20 EMA, 50 EMA, 100 EMA and 200 EMA versions sit at $9.148, $9.400, $9.710 and $10.101.
Nov 15 brought the low at $8.574, where buyers defended the lower channel line. Price then reclaimed $8.885 and $9.026, a support level where buyers have stepped in before.
Now LINK trades at $9.266, above the 20 EMA and pressing the upper line. RSI, a 0 to 100 gauge of buying strength, is at 52.87 after dipping under 20 on Nov 15.
But a breakout needs a hold above the line. This Chainlink price analysis treats a single poke as noise, and the earlier falling wedge setup showed how LINK handles sloped patterns.
Support and Resistance Levels Worth Tracking
Demand zone first. $9.026 held on to a small pullback before the latest push, and $8.885 sits just under it.
The above price, $9.400 comes first, then $9.656 and $10.157. The old $10 floor from the Schwab floor test is resistance now.
And $10.593 caps the whole move.
Liquidations Hit Longs as Fear Index Sits at 11
Longs got wiped. CoinGlass derivatives data shows $9.20M liquidated in 24 hours, 98% of it in long positions. A liquidation is a forced exit when a trade runs out of margin.
Open interest fell 6.91% to $401.26M. That's the total value of open futures contracts. Traders are leaving.
The funding rate turned negative at -0.0026%. Funding is the fee longs and shorts pay each other, so negative means shorts pay longs.
Futures volume hit $639.48M against $124.87M in spot.
Fear and Greed shows 11. That's Extreme Fear, and nothing about it is bullish.
Bounce Quality Versus Spot Flows
Spot net flow was -9.1M and futures flow-26.1M. Buyers haven't returned in size.
Is a bounce real if spot money keeps leaving? Volume jumped 70.86% on the day.
At first that sounds weak. Then again, heavy volume near $8.574 means someone absorbed the selling.
The bounce is real, but only if. Spot flows have to turn positive.
The reserve buy bounce is a useful comparison for how LINK trades after a flush.
US Spot LINK ETF Flows Stay Flat
SoSoValue ETF data shows $0.00 in daily net inflow as of Nov 14. Cumulative inflow stands at $175.69M and net assets at $173.43M.
Bitwise's CLNK traded at $18.08, down 0.75%, and Greyscale's GLNK at $8.82, down 0.79%. Total value traded was $4.30M.
No new money came in. That's neutral at best, and it leaves the bounce without an institutional bid.
LinkNYC Talks and New Integrations
At LinkNYC, DivesTech of Yorkville Ives called AI the best thing to happen to crypto, and Chainlink's latest X post pushed the clip.
Chainlink announced 3 integrations on Nov 14. Aave and LlamaRisk will use CRE, the Chainlink Runtime Environment, for borrow caps that adjust to demand on Aave V3. b1m_ai will use it for verifiable on-chain receipts, and Cordex will pull institutional asset prices through Data Streams on Solana.
Useful adoption news. But the price still fell 4%, and the Chainlink price prediction doesn't change until buyers confirm.
LINK Price Forecast Scenarios
Chainlink Price Prediction Scenario Table
Oversold readings, like the earlier RSI oversold breakdown don't promise a reversal. But this LINK price forecast has clear lines, and each target below ties to one trigger.
Scenario | Trigger | Target | Invalidation | Liquidity Condition |
Bull | Hold above channel line, trade over $9.400 | $9.656, then $10.101 | Back under $9.026 | Spot volume rising, spot flow positive |
Base | Range between $9.026 and $9.400 | $9.026 to $9.400 | Break of either level | Flat volume, funding near zero |
Bear | Trade under $9.026 | $8.885, then $8.574 | Reclaim of $9.400 | Futures volume up, new long liquidations |
Chainlink Price Outlook for the Week Ahead
Bias is mildly bullish while $9.026 holds. The 50 EMA at $9.400 decides if the breakout is real.
A trade through $9.656 puts $10.101 in play. Under $9.026, the next stop is $8.885, then the $8.574 low.
This Chainlink price outlook stays short-term, and month-level targets sit in the November 2026 forecast.
Risks That Can Break the Chainlink Price Prediction
Fear at 11 can sit there for weeks. A drop under $9.026 matters because, It turns the bounce into a lower high inside the channel, and $8.574 comes back into play.
Flat ETF flows and -$9.1M in spot flow give buyers little backup and the wider November market dip still weighs on altcoins.
Fresh long liquidations on a break under $9.026 would confirm the bear case. Price sits right at the line that decides it.
Disclaimer: This article is for information only and isn't financial advice. Crypto prices swing fast, and any trade can lose money. Readers should do their own research before acting on any level or scenario here.