Core PCE Inflation: Wednesday's Data Could Shake Markets This Week


Core PCE Inflation: 5 Key Signals Traders Watch This Thanksgiving Week
The last week of November is short on trading days but full of important numbers.
The biggest event is the release of October's Core PCE inflation data on Wednesday, November 25, right before the Thanksgiving break.
Below is the full week laid out day by day, using the official calendars of the U.S. Bureau of Economic Analysis (BEA), the Federal Reserve, and the New York Stock Exchange.
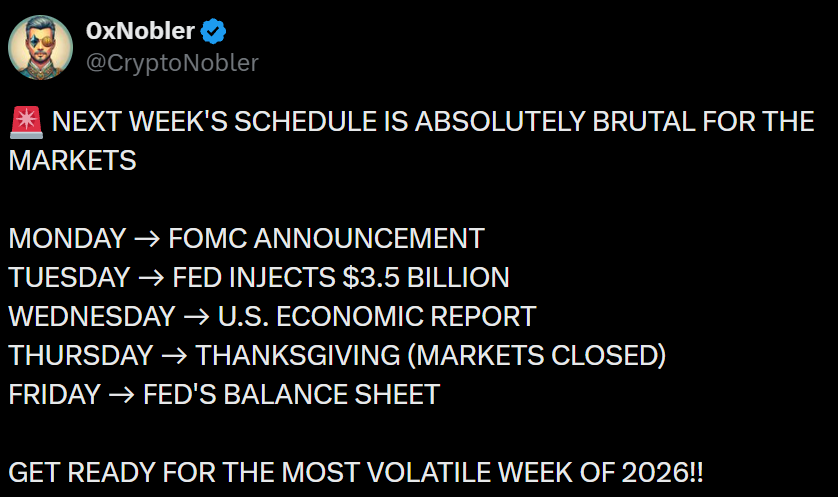
Source: Post on x
Thanksgiving Week Calendar at a Glance
The Federal Reserve's November calendar and the BEA schedule give a clear picture of the week:
| Day | What is scheduled |
| Monday, Nov 23 | Routine Fed data on exchange rates and interest rates |
| Tuesday, Nov 24 | Fed money stock report at 1:00 p.m. |
| Wednesday, Nov 25 | BEA income and spending data plus GDP update at 8:30 a.m.; Fed Beige Book at 2:00 p.m. |
| Thursday, Nov 26 | Thanksgiving Day, U.S. stock markets closed |
| Friday, Nov 27 | Stock markets close early at 1:00 p.m.; Fed weekly balance sheet report at 4:30 p.m. |
One point needs care. The Fed's calendar lists no FOMC meeting this week. The only FOMC item in November is the release of minutes from the Oct 27-28 meeting, which came out on Nov 18.
Core PCE Inflation: What BEA Will Release on November 25
The BEA release for September states that the next report, Personal Income and Outlays for October 2026, arrives on Nov 25 at 8:30 a.m. Eastern.
That report includes the PCE price index, the inflation gauge the Fed watches closely.
The core version leaves out food and energy, whose prices often swing sharply, so it gives a steadier view of price trends.
Here is why this release matters:
-
It is the freshest inflation reading: It covers October, one month after the September figures.
-
It sits next to growth data: The BEA will also publish its second estimate of third-quarter GDP and corporate profits at the same time.
-
It lands before a long break: Markets close Thursday and trade only a short session on Friday.
Latest Reading: September Inflation and Spending
To judge what comes next, start with the last report. The numbers below are all from the September release:
| Measure | September 2026 |
| Excluding food and energy, monthly | +0.3% |
| Excluding food and energy, yearly | +3.1% |
| Overall price index, monthly | +0.5% |
| Overall price index, yearly | +3.6% |
| Personal income | +$54.5 billion (+0.2%) |
| Consumer spending | +$113.1 billion (+0.5%) |
| Personal saving rate | 3.8% |
Core PCE inflation rose 0.3% in September, the same pace as August, while the overall index rose 0.5% after a 0.3% gain in August.
Spending on services grew by $78.1 billion and goods by $35.1 billion. After adjusting for prices, spending was nearly flat, and real disposable income fell 0.3%.
In simple words, households spent more dollars, but higher prices ate up the gain.
GDP Second Estimate: A Check on Third-Quarter Growth
The advance GDP estimate showed the economy growing at a 3.4% annual rate in the third quarter, up from 2.2% in the second.
It also showed that inflation cooled over the quarter:
-
Overall price index: Up 2.1% at an annual rate, down from 5.0% in the second quarter.
-
Excluding food and energy: Up 2.5%, down from 3.3%.
-
Strong private demand: Real final sales to private domestic purchasers rose 4.9%.
The second estimate on Wednesday can revise these figures, so growth and price numbers may shift.
Thanksgiving Closures and the Fed's Weekly Reports
The NYSE holiday schedule confirms that markets are closed on Thursday, with an early 1:00 p.m. close on Friday.
The Fed's calendar adds that releases scheduled for Thanksgiving will move to Friday, and its weekly report on reserve balances, which tracks the Fed's balance sheet, is listed for Friday.
The Fed's Beige Book on Wednesday adds a different angle. It is a report on economic conditions, and it lands the same day as the BEA data.
Here is what to watch on release day:
-
Whether October's monthly change stays at 0.3% or moves away from September's pace.
-
Whether the yearly rate stays near 3.1%.
-
Whether revised third-quarter GDP holds near 3.4%.
-
What the Beige Book says about prices.
Conclusion
The week comes down to Wednesday. Core PCE inflation for October, the GDP update and the Beige Book all arrive within hours of each other, and then markets pause for the holiday.
September's reading of 0.3% for the month and 3.1% for the year is the benchmark to compare against. Always check official releases for the final numbers.
Disclaimer
This article is for educational and informational purposes only and is not financial or investment advice. Crypto assets are high risk, their prices can be very volatile, and you can lose some or all of your money. Always do your own research and consider speaking with a licensed financial advisor before making investment decisions.






