Dogecoin Price Prediction: DOGE’s 30,000% Rally! Mega Setup Is Back?


A trader is calling out a chart pattern on Dogecoin's monthly chart that appeared just before DOGE's explosive 2021 rally. DOGE is trading at $0.079971, down 6% today, sitting right below the $0.100005 level the post identifies as the pattern's neckline.
Confirming this setup would need a monthly close above that neckline, which hasn't happened yet, so the pattern remains unconfirmed rather than a guaranteed repeat.
This Dogecoin price prediction looks at both the claim and the daily chart's own nearer-term levels.
Dogecoin News Today: Inverse Head and Shoulders Pattern
A post from Trader on X says Dogecoin's monthly chart is forming an inverse head and shoulders, a reversal pattern where price carves out three troughs, a deeper middle low flanked by two shallower ones, read by traders as a sign selling pressure may be fading.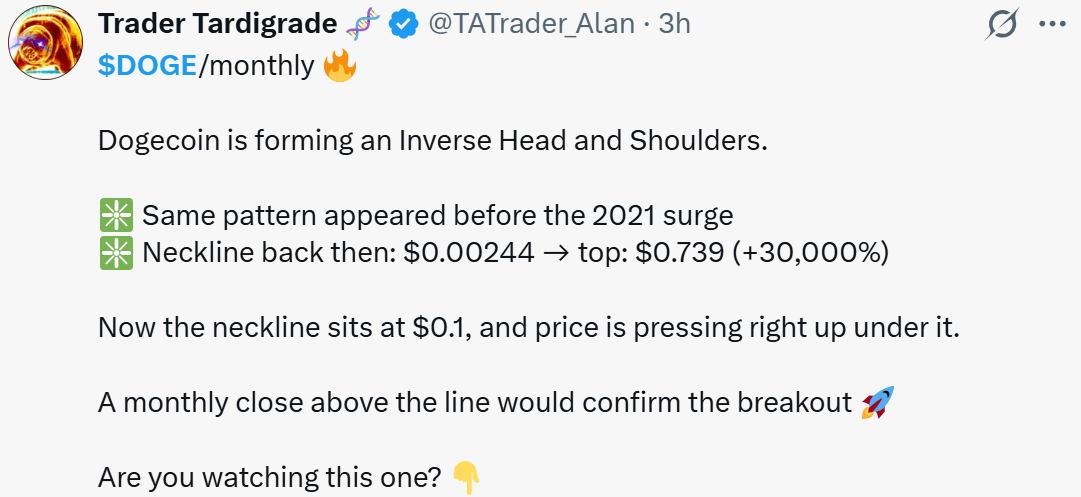
The post points to the same pattern before DOGE's 2021 rally, when it says the neckline, the resistance line connecting the pattern's two shoulder highs, sat near $0.00244 before the price ran to a top of $0.739, a move it calculates at roughly +30,000%.
It places today's neckline near $0.1 and says a monthly close above that line would confirm a breakout.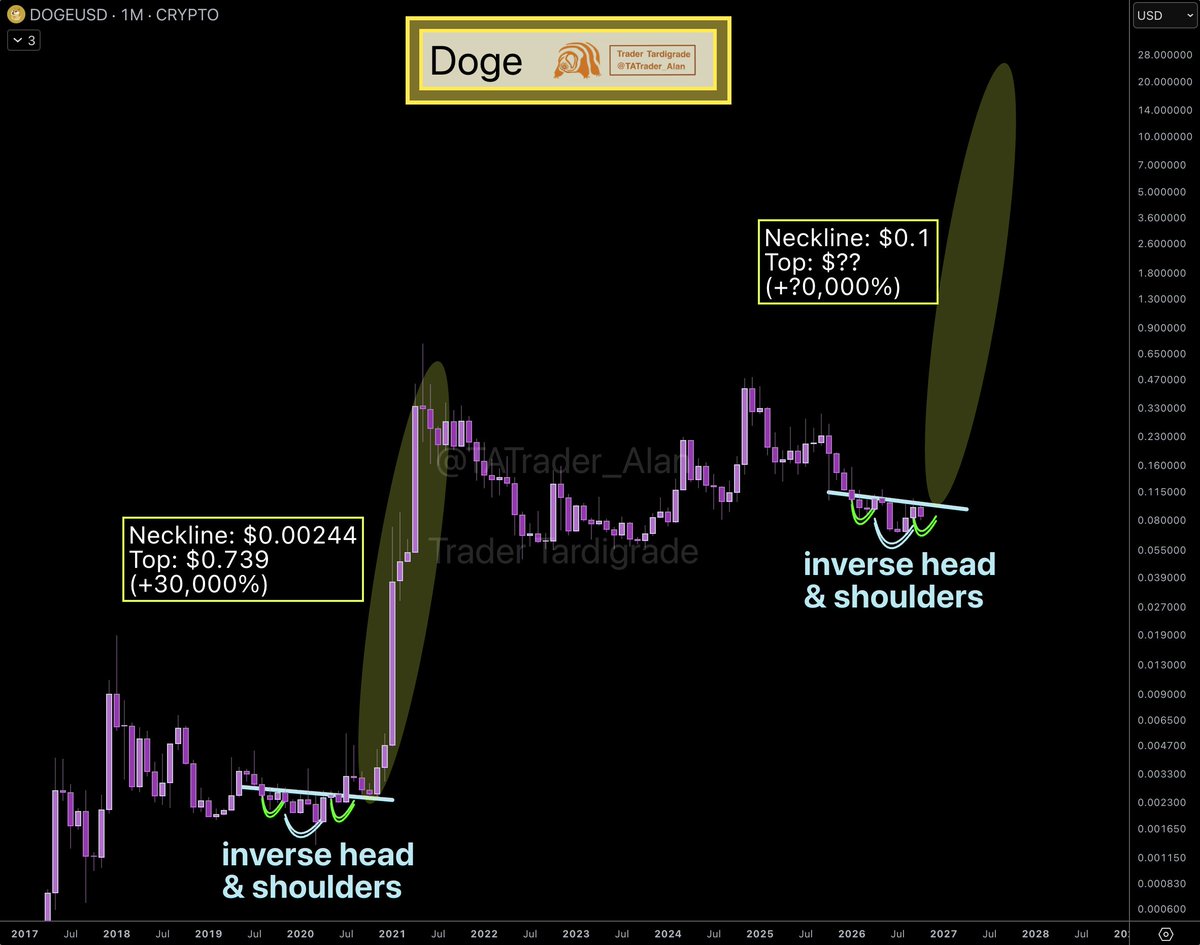
Source: Data From X
This is one trader's pattern read, not a confirmed signal, and CoinGabbar could not independently verify the historical figures cited.
Why is DOGE price down today?
Dogecoin price today is down 6% to $0.079971 in 24h, underperforming a broader market decline primarily driven by a risk-off reaction to hotter-than-expected U.S. inflation data. This triggered significant leveraged liquidations and selling pressure across crypto assets.
Primary reason: Macro-driven market sell-off after September CPI data exceeded forecasts, raising fears of prolonged restrictive Fed policy and hitting risk assets.
Secondary reasons: Amplified selling from cascading liquidations of leveraged long positions, particularly in Bitcoin, which spilled over into altcoins like DOGE.
Dogecoin News: DOGE Liquidations Stay Long-Heavy
Window | Total Liquidated | Long | Short |
12h | $10.87M | $8.69M | $2.18M |
24h | $12.96M | $10.64M | $2.32M |
Source: Data From CoinGlass
Longs took the clear majority of liquidations in both windows, roughly 80% of the 24-hour total.
That lines up with today's decline, as traders positioned for upside got caught by the drop toward $0.08.
What could affect DOGE’s future price?
Dogecoin stands at a crossroads between its meme origins and a future of tangible utility and regulation.
Supply Policy Shift – A formal proposal to cut annual issuance by 90% could dramatically alter DOGE's inflation model, pending community consensus.
Regulatory & ETF Tailwinds – Evolving U.S. legislation and potential spot ETF approvals could unlock institutional demand and legitimize DOGE as a digital commodity.
Whale Accumulation Signals – Large holders have been buying significant dips, suggesting strategic positioning that could precede a price rebound.
DOGE Technical Analysis
DOGE is trading at $0.079971, down 6%, slipping below the $0.080000 level that had acted as support through most of October.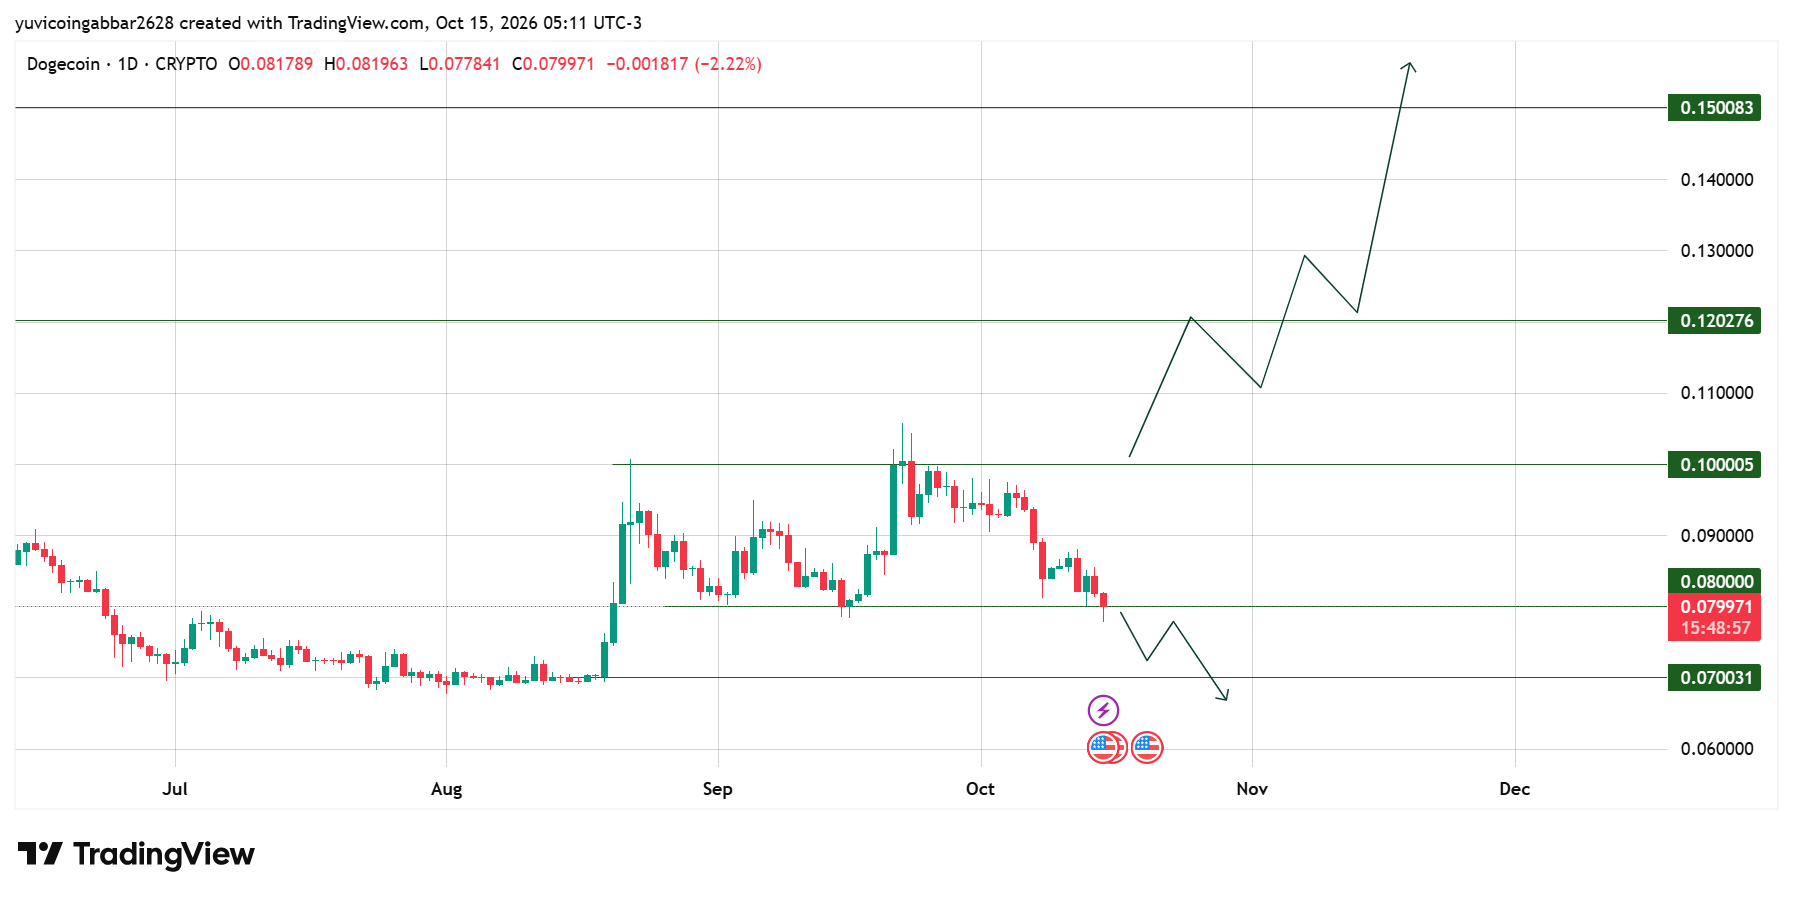
The chart shows a possible further slide toward $0.070031 before any recovery attempt, alongside a separate longer-term path back up through $0.100005, $0.120276, and $0.150083 if price reverses.
These are two different scenarios marked on the same chart, not one confirmed direction.
DOGE Price Scenarios: Bull, Base, and Bear Case
Bull case: A daily close back above $0.080000 would ease near-term pressure and open a path toward $0.100005, the same level the inverse head-and-shoulders post marks as its neckline.
Base case: DOGE drifts between $0.070031 and $0.080000 while the market waits to see if the monthly pattern plays out.
Bear case: A daily close below $0.077841 extends the slide toward $0.070031, with no further chart level marked below it.
Support
$0.070031 is the deeper support below the current price; $0.077841 marks the more immediate level from today's low.
Resistance
$0.080000 is the nearest resistance, which would need to be reclaimed before testing $0.100005, the monthly neckline, then $0.120276 and $0.150083.
Dogecoin Forecast: Triggers and Invalidation
Scenario | Trigger | Likely Outcome | Invalidation |
Support reclaim | Close above $0.080000 | Push toward $0.100005 | Close below $0.077841 |
Range holds | Consolidate 0.070031–0.080000 | Base forms | Break below $0.070031 |
Decline continues | Close below $0.077841 | Slide toward $0.070031 | Reclaim $0.080000 |
Dogecoin Price Prediction: Could $DOGE Really Repeat Its 2021 Move?
Not based on anything confirmed yet. The inverse head-and-shoulders pattern is still unconfirmed, since the post itself says a monthly close above the $0.1 neckline is needed, and that hasn't happened.
The chart's own path toward $0.150083 would also need DOGE to reclaim $0.080000 and clear $0.100005 and $0.120276 in sequence.
The +30,000% figure from 2021 describes a historical move under different market conditions and isn't a repeatable outcome CoinGabbar could verify.
Dogecoin Price Prediction 2026: Expert Analysis
According to CoinGabbar analysts, today's slip below $0.080000 is the more immediate development, separate from the monthly pattern being discussed online.
The long-heavy liquidation data show today's drop caught some bulls off guard. $0.077841 is the level that would need to hold for this to look like a pause rather than the start of a deeper move toward $0.070031.
This read is based on the daily chart levels above, not the monthly timeframe the pattern claim refers to.
Disclaimer
This article is for informational purposes only and isn't financial advice. Crypto markets are volatile. Always do your own research before making any trading decisions involving $DOGE.
















