Dogecoin Price Prediction: Can DOGE Hit $4.20 as History Repeats?


Dogecoin’s past cycles have sparked fresh speculation, with one historical analysis pointing to a potential 365X rally while another highlights a $4.20 target. Can DOGE repeat its explosive history, or will this cycle tell a different story?
Anyone still waiting on the sidelines will want to know if they have missed it.
This Dogecoin Price Prediction covers both claims: the liquidation data and the levels on the chart.
Market data checked on October 13, 2026 at 03:37 UTC-3.
Dogecoin Outlook: Market Overview
Metric | Value |
Current Price | $0.084909 |
Change | -2.90% |
Why is DOGE’s price down today?
Dogecoin price today is down 2.90% to $0.084909 in 24h, underperforming a slightly negative broader market, primarily driven by a sector-wide altcoin selloff and liquidation cascade.
Primary reason: Broad risk-off move hitting altcoins, amplified by an $803 million liquidation event that forced long positions to unwind.
Secondary reasons: Macro pressures from U.S. spot Bitcoin ETF outflows and rising Treasury yields, combined with a technical breakdown below key support.
DOGE Liquidation and Futures Volume Data
A liquidation happens when an exchange force-closes a leveraged trade because the trader can no longer cover the loss. A long bet on a rise and a short bet on a fall.
Window | Total | Long | Short |
1h | $19.67K | $76.92 | $19.59K |
4h | $140.31K | $16.72K | $123.59K |
12h | $8.58M | $8.04M | $537.94K |
24h | $10.54M | $9.87M | $665.15K |
Longs made up about 94% of the 24-hour total. The latest 4 hours flipped, with shorts at about 88%. A drop toward support can force longs out of trades, and a bounce can force shorts out.
Binance leads futures volume at $604.84M, followed by OKX at $342.85M.
Source: Coinglass futures data, separate from spot volume.
Dogecoin News Today: Post Says the DOGE Floor Is In
A post on X says each past DOGE cycle moved from a floor to a huge peak. It lists a 0.0001 floor with a 167X peak, a 0.0002 floor with a 365X peak, and a 0.0004 floor with the peak left as question marks.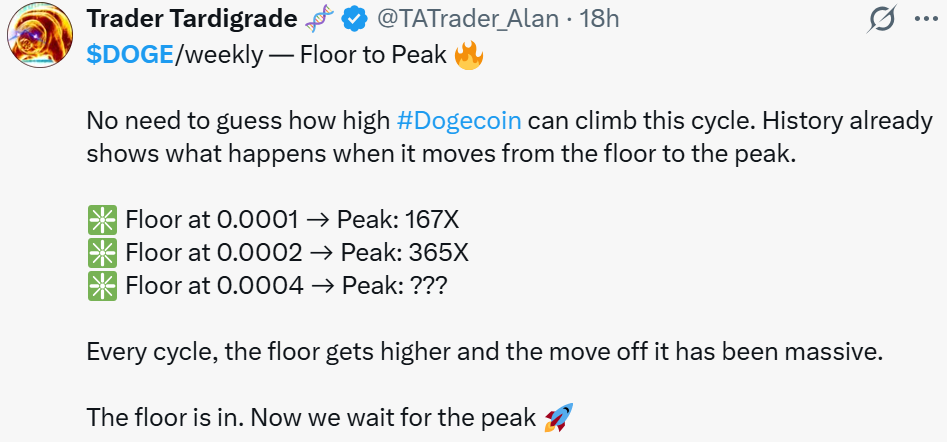
Source: Data From X
CoinGabbar could not verify these figures. The post does not say which chart or units it uses, and its floor levels do not match DOGE's range of about $0.07 to $0.10 on the daily chart.
DOGE News: Post Eyes $4.20 If History Repeats
Another post on X says DOGE has followed one pattern for 12 years: every major resistance point eventually became support.
Resistance is a price area where sellers have stopped rallies, and support is where buyers have stepped in. The post names a bullish target of $4.20 "if history rhymes."
It describes a descending channel. The daily chart used here shows a rising channel, so the two views may use different time frames.
CoinGabbar could not verify the claims, and $4.20 is about 49 times today's price.
$DOGE Technical Analysis
DOGE traded near $0.070031 through August, then jumped and began moving inside a rising channel. A channel is a pair of sloping lines that price moves between.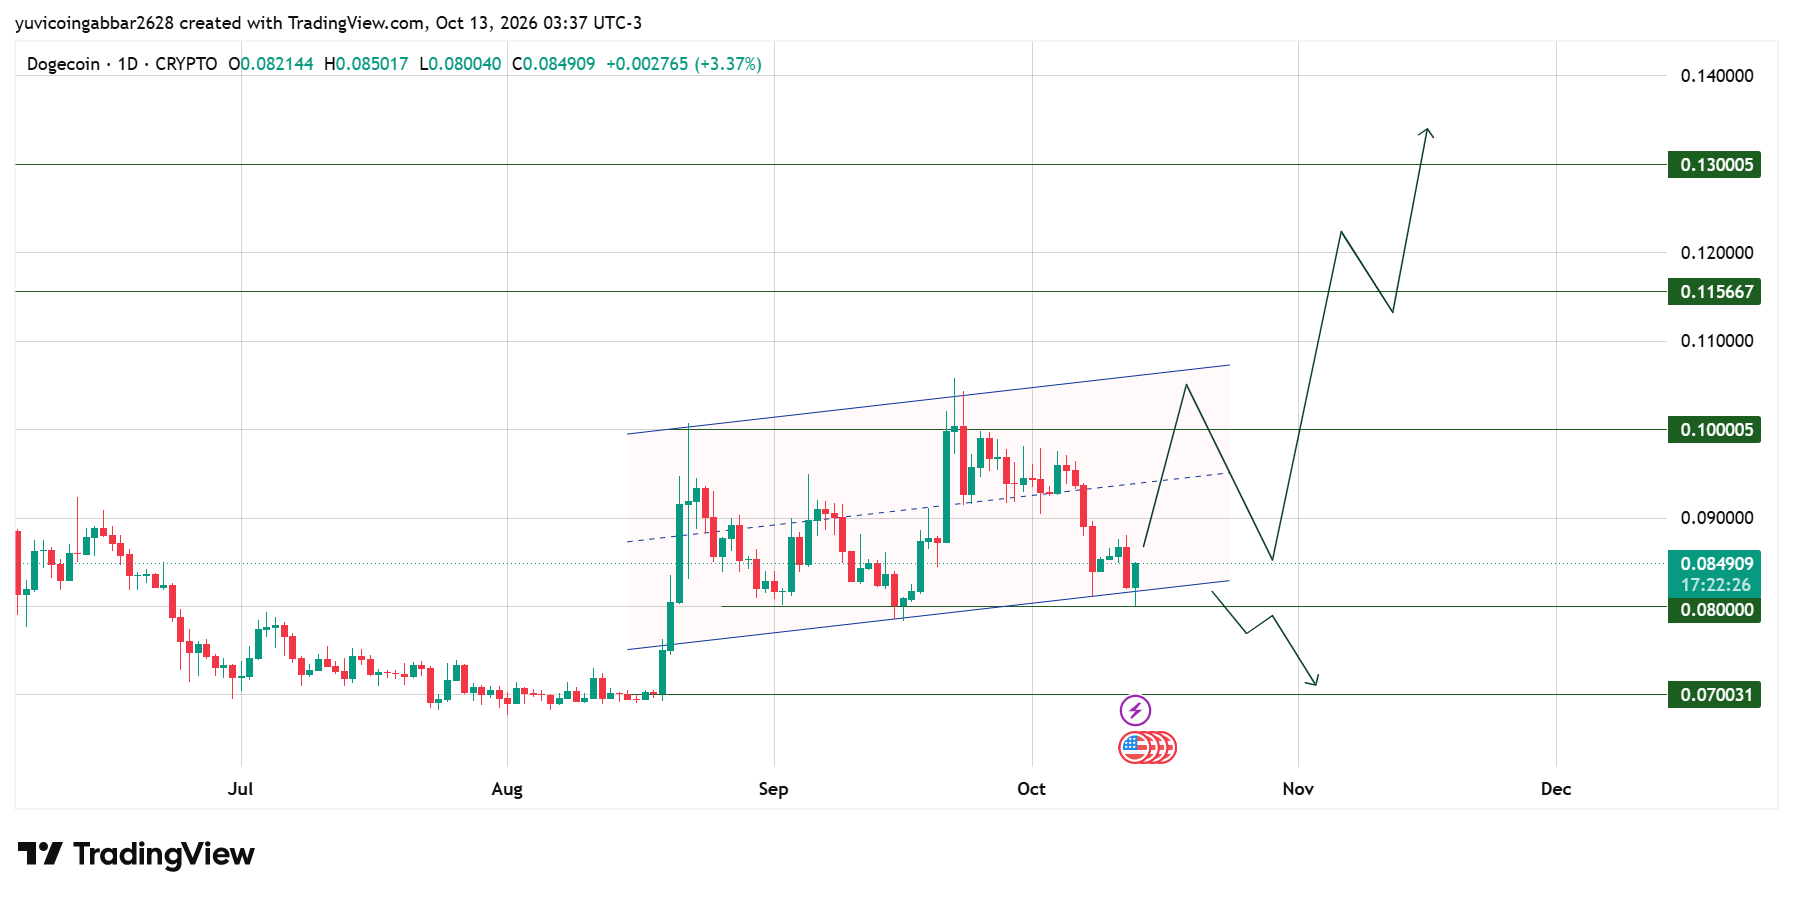 Price peaked above $0.100005 in late September and fell in early October. Today's candle touched $0.080040, just above the marked $0.080000 support and near the lower channel line, then bounced to $0.084909.
Price is trading within a channel. To maintain the bullish trend, it must hold above the $0.08000 support level and break above $0.100005. A sustained move above this resistance could trigger a bullish rally.
DOGE Support and Resistance Levels in This DOGE Forecast
Level | Type |
$0.130005 | Resistance (highest marked) |
$0.115667 | Resistance |
$0.100005 | Resistance (nearest marked) |
$0.080000 | Support (first) |
$0.070031 | Support (deeper) |
Dogecoin Forecast: Triggers and Invalidation
Scenario | Trigger | Likely Outcome | Invalidation |
Channel hold | Closes stay above $0.080000 | Move toward $0.100005 | Close below $0.080000 |
Resistance break | Close above $0.100005 | Push toward $0.115667 | Close back below $0.100005 |
Channel breakdown | Close below $0.080000 | Slide toward $0.070031 | Reclaim $0.080000 |
A close is the price where a daily candle finishes.
Dogecoin Price Prediction: Can $DOGE Reach $0.13?
$DOGE would need to pass $0.100005 and $0.115667 first. A move to $0.130005 from $0.084909 is a gain of about 53%.
Dogecoin Price Prediction 2026: Expert View
According to CoinGabbar analysts, Both posts argue the bottom is in, but the chart so far shows a bounce from $0.0800, not a confirmed turn. Buyers defended support today, which is a start. A daily close above $0.100005 would be the first clear proof.
Disclaimer
This article is for informational purposes only and is not financial advice. Crypto markets are volatile. Do your own research before making any trading decisions involving $DOGE.

















