Dogecoin Price Prediction: Bullish Divergence Signals Altseason Rally?


Is DOGE about to wake up the altcoin market? One trader says Dogecoin has reclaimed a key support zone and that the last two times this happened, it rallied over 15%.
This Dogecoin Price Prediction covers that claim, "Hidden Bullish Divergence," the liquidation data, and the levels on the chart.
Market data checked on October 12, 2026 at 02:54 UTC-3.
Dogecoin Price Prediction Today: Market Overview
Metric | Value |
Price | $0.087722 |
Change (current 1D candle) | +2.5% |
DOGE News Today: $DOGE Liquidation and Futures Volume Data
A liquidation happens when an exchange force-closes a leveraged trade because the trader can no longer cover the loss. A long bet on a rise and a short bet on a fall.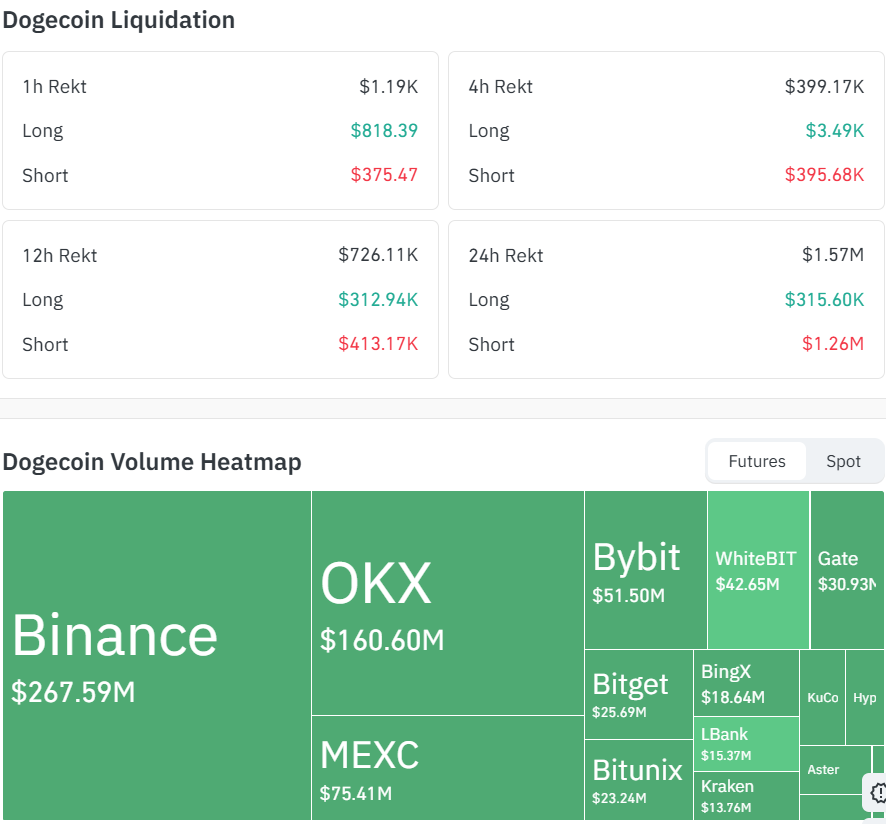
Window | Total | Long | Short |
1h | $1.19K | $818.39 | $375.47 |
4h | $399.17K | $3.49K | $395.68K |
12h | $726.11K | $312.94K | $413.17K |
24h | $1.57M | $315.60K | $1.26M |
Shorts made up about 80% of the 24-hour total and about 99% of the 4-hour total. Rising prices can force short sellers out of trades. Binance leads futures volume at $267.59M, followed by OKX at $160.60M.
Source: Coinglass futures data, separate from spot volume.
Dogecoin News: Trader Says $DOGE Reclaimed Key Support
$DOGE has reclaimed its key support zone and it rallied over 15% the last two times that happened. It adds that a DOGE rally has historically been an early altseason signal.
An altseason is a period when altcoins, meaning coins other than Bitcoin, rise faster than Bitcoin.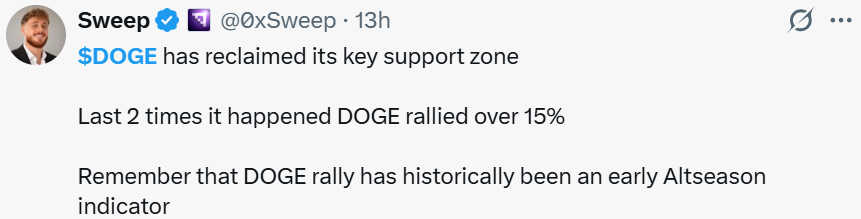
Source: Data From X
CoinGabbar could not verify the past rallies or the altseason link, and past patterns do not guarantee a repeat.
DOGE Outlook: Post Flags a Hidden Bullish Divergence
Another post on X is headlined "Hidden Bullish Divergence." It describes price making a higher low while an indicator, such as the RSI, makes a lower low.
Traders read it as a sign an uptrend may continue, so CoinGabbar could not verify the claim.
Dogecoin Technical Analysis
$DOGE climbed from the $0.070031 base in August and moved within a rising channel before facing resistance near $0.100005 in late September.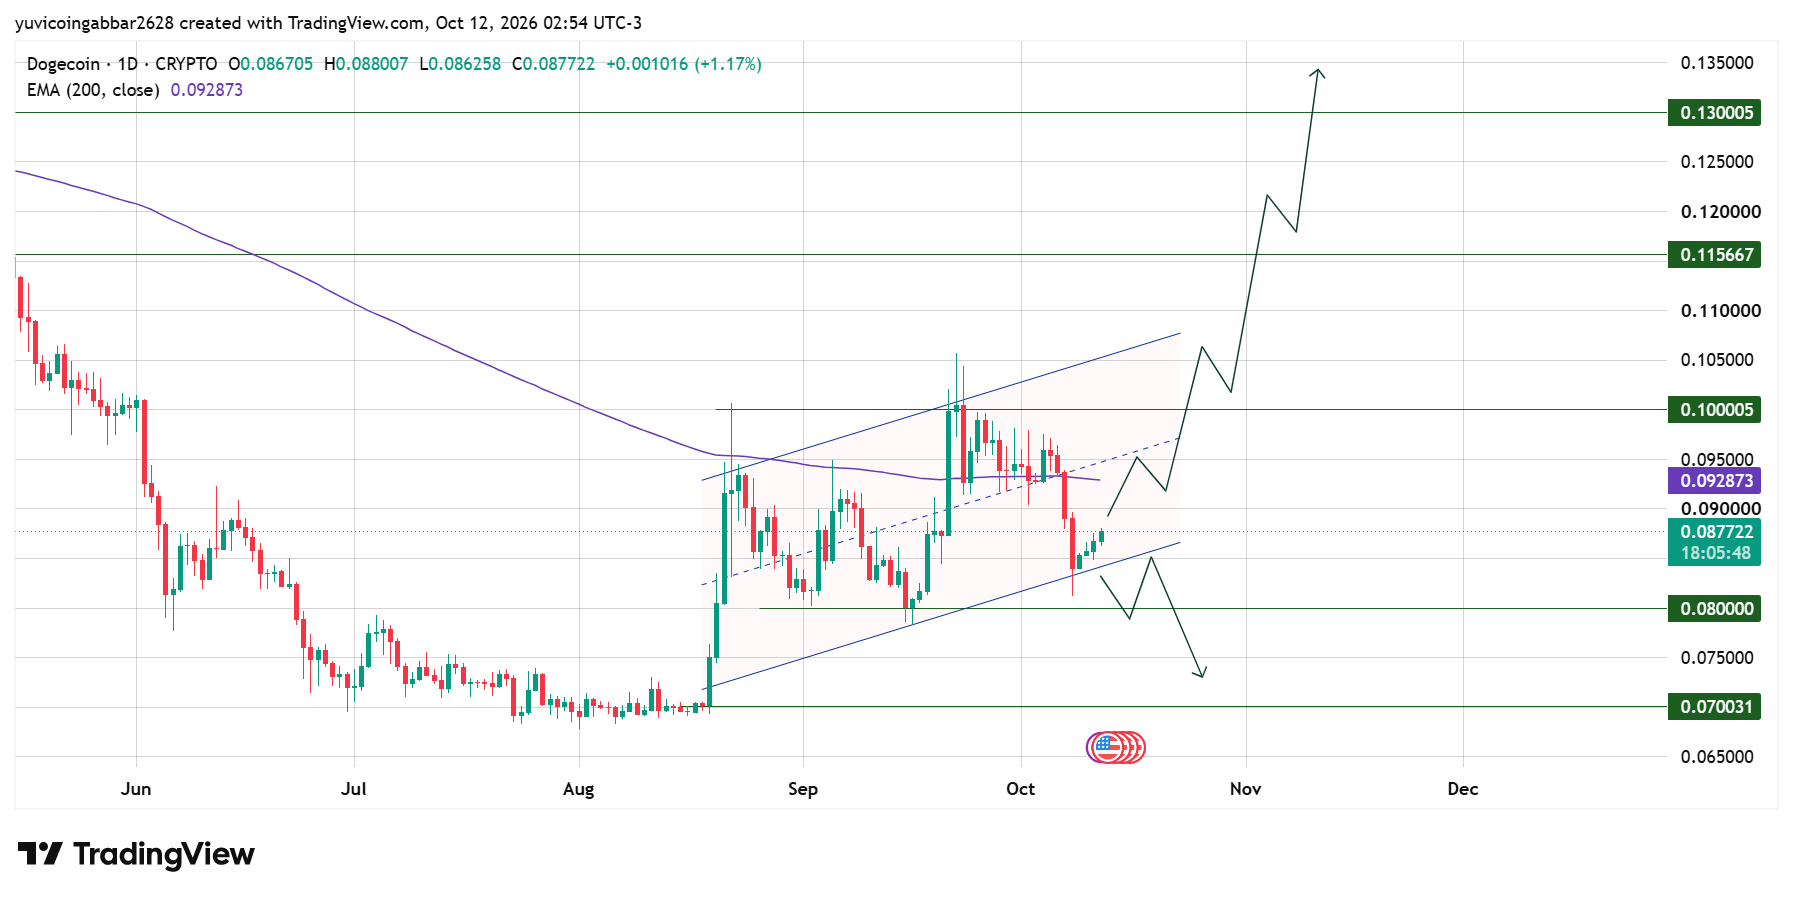
In early October, the price slipped below the channel’s lower trendline but bounced near the $0.080000 support zone. $DOGE is now trading around $0.087722, below the 200 EMA at $0.092873.
The next move depends on whether buyers can reclaim the EMA and restore the channel structure or sellers push the price below $0.080000.
$DOGE Support and Resistance Levels in This DOGE Forecast
Level | Type |
$0.130005 | Resistance (highest marked) |
$0.115667 | Resistance |
$0.100005 | Resistance (nearest marked) |
$0.080000 | Support (first) |
$0.070031 | Support (deeper) |
DOGE Price Forecast: Triggers and Invalidation
Scenario | Trigger | Likely Outcome | Invalidation |
Channel hold | Closes stay above $0.080000 | Move toward $0.092873 | Close below $0.080000 |
EMA reclaim | Close above $0.092873 | Push toward $0.100005 | Close back below $0.092873 |
Channel breakdown | Close below $0.080000 | Slide toward $0.070031 | Reclaim $0.080000 |
Dogecoin Price Prediction: Can $DOGE Reach $0.13?
$DOGE would need to pass $0.092873, $0.100005 and $0.115667 first. A move to $0.130005 from $0.087722 is a gain of about 48%, while $0.100005 is about 14% away. The Dogecoin chart does not show that move yet.
Dogecoin Price Prediction 2026: Expert View
According to CoinGabbar analysts, the bounce has brought the price close to the 200 EMA. The altseason idea is a trader's opinion, not something the chart shows. The next test is a daily close above $0.092873.
Disclaimer
This article is for informational purposes only and is not financial advice. Crypto markets are volatile. Do your own research before making any trading decisions involving $DOGE.

















