Chainlink Price Prediction: Can LINK Break Its Triangle Today?


Can one record ETF day really push LINK through a stubborn ceiling?
That's the question behind every Chainlink price prediction today, and the crypto price prediction hub hasn't settled it. Chainlink price today reads $13.36, up 4%. But a 6.31% weekly drop keeps buyers cautious.
Chainlink Price Prediction: Where LINK Trades Now
Current Price and 24H Performance
LINK trades at $13.36, up 4% in 24 hours, inside a $12.84 to $13.48 range, per CoinMarketCap live data. Data time: Oct 12, 2026, 09:00 UTC.
Zoom out and the story improves, with 30-day gains of 15.90%. But the one-year view still shows a 22.30% loss.
Volume and Market Cap
Market cap sits at $9.99B, while 24-hour volume jumped 38.59% to $242.75M. Rising volume matters, since rallies on thin trading usually fade.
Circulating Supply
Circulating supply is 748.09M of a 1B maximum, which leaves 251.91M LINK outside the market. The Community Staking Pool alone holds 40.88M LINK, as covered in the LINK staking update.
Chainlink ETF Inflows: A Record Day on Oct 9
Daily Inflow Numbers
Chainlink ETF inflows hit $9.48M on Oct 9, 2026, per the SoSoValue ETF tracker.
BSCN called it the biggest single day since launch, though that's a social media claim, not an exchange record. Five flat sessions came first. Then, all at once, $9.48M.
Grayscale vs Bitwise
Grayscale's GLNK took all $9.48M, while Bitwise's CLNK saw $0.
Total net assets reached $225.35M, about 2.35% of LINK's market cap, and the earlier ETF breakout analysis tracked the same product flows. Small money. Loud headline.
Chainlink News Today: Three Updates in 24 Hours
Security Post From Chainlink
Fresh post. Chainlink calls security the defining requirement for on-chain markets.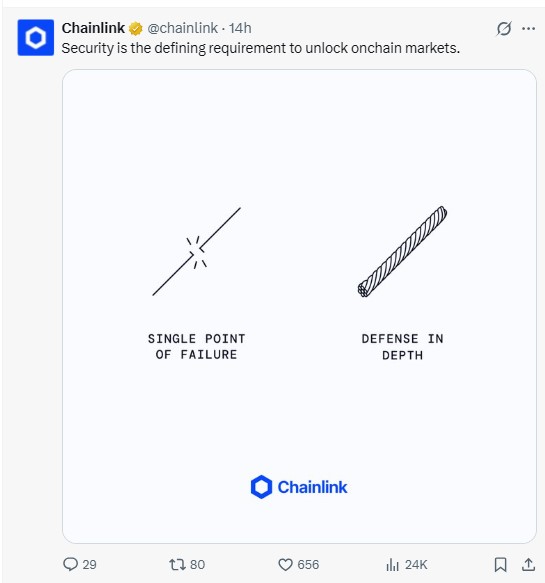
The graphic pits a single point of failure against defense in depth, per the Chainlink security post, posted about 14 hours before Oct 12, 2026, 09:00 UTC.
Link: NYC Speaker Lineup
Link: NYC is set for Oct 29. More than 35 speakers. DTCC, Swift, Fidelity, Citi, and Morgan Stanley appear on the list, per the NYC announcement.
Treasury Reserve Claim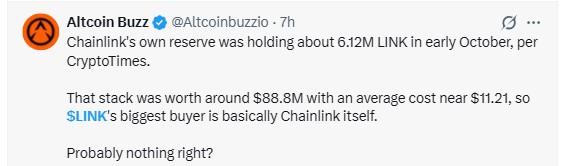
Altcoin Buzz, citing CryptoTimes, says Chainlink's own reserve held about 6.12M LINK in early October. Average cost reportedly sits near $11.21.
At $13.36, that stack sits about 19% above cost, which reads bullish. Or maybe not, since a reserve in profit can also sell. Treat it as a lead, not a verified fact.
Holder Data and Whale Concentration
Holder Count
Etherscan lists 915,138 LINK holders, and the LINK wallet count trend tracked how that base has shifted. A bigger base hasn't stopped the weekly slide.
Whale Concentration
Whales, meaning very large wallets, hold 90.93% of market cap while making up only 0.49% of holders, per Etherscan holder data.
The top 100 wallets control 61.58%, and Binance 28 alone holds 4.2203% of supply. Who sells first if the price stalls?
LINK Derivatives Data: Longs Lead, Shorts Squeezed
Futures volume reached $391.40M against $64.32M in spot, per CoinGlass derivatives data. Open interest, the total value of open futures contracts, stands at $643.91M.
Binance's long/short ratio, which compares accounts betting up against accounts betting down, reads 1.6385, and OKX shows 2.52.
Liquidations, meaning forced exits from margin trades, totaled $292.28K in 24 hours. Shorts took $239.60K.
Bitcoin and Ethereum Backdrop
Bitcoin trades at $83,590.48, up 0.76%, while Ethereum sits at $2,551.65, up 2.16%, per CoinMarketCap on Oct 12, 2026, 09:00 UTC. Altcoins rarely rally alone, and volume rose on both majors. Cooperation helps.
LINK Technical Analysis: Ascending Triangle on the 1-Hour Chart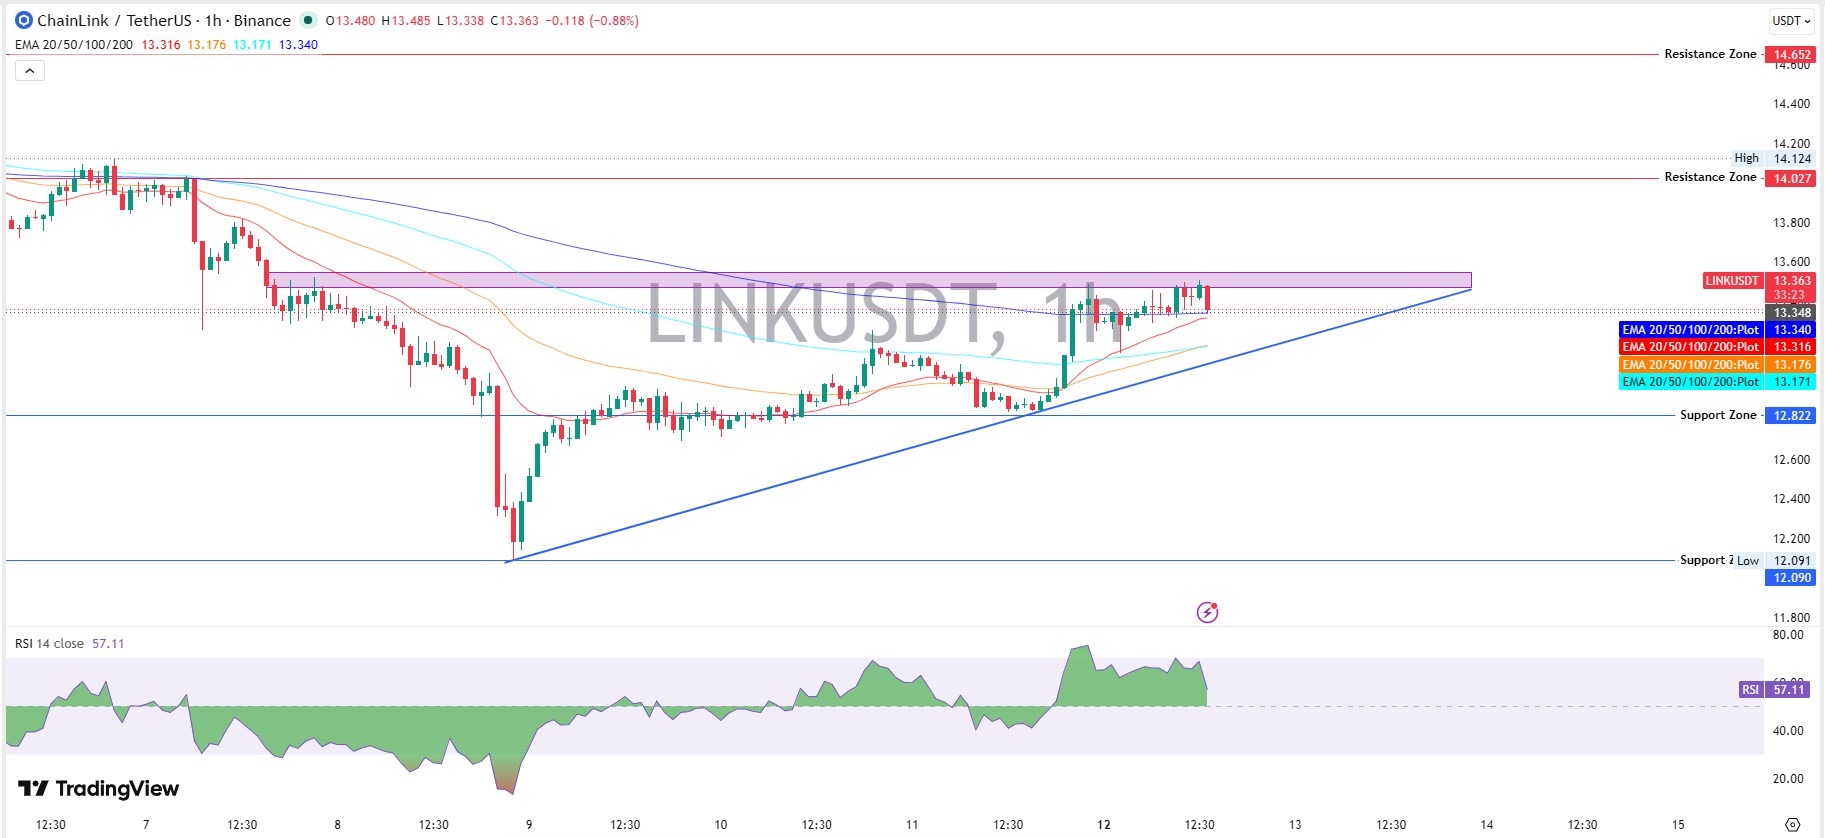
LINK technical analysis starts with the 1-hour Binance chart on the TradingView LINK chart, where a rising trendline presses into a flat supply zone.
That setup is an ascending triangle, a pattern where higher lows squeeze price toward a fixed ceiling.
The latest trades printed $13,363, after a $13,485 high. RSI reads 57.11, so buyers lead without overheating.
EMA, a moving average that weights recent trades more heavily, reads $13.316 (20 EMA), $13.176 (50 EMA), $13.171 (100 EMA), and $13.340 (200 EMA).
Price trades above all four, but only 0.17% above the 200 EMA. And that thin cushion matters. Bias leans mildly bullish while the trendline holds. But triangles can break down too.
Key Support Levels
For $LINK support and resistance, the first support sits at $12.822, about 4.05% below price. Next comes the $12.090 low, roughly 9.5% lower. Lose the trendline first, and $12.822 comes into play fast.
Key Resistance Levels
Resistance starts at the shaded supply zone near $13.50, then $14.027 and $14.652. The $14.027 level sits about 5% above price, and the $14.124 high from Oct 7 caps that area.
Chainlink Price Forecast: Three Scenarios
Bullish Scenario
The $LINK price target begins at $14.027. If $LINK breaks the $13.50 zone on rising volume and holds the trendline, that level could open within seven days.
A second target, $14.652, would need that first. Trading below $12.822 would cancel the idea.
Base Scenario
Chop between $12.822 and $13.50 stays the base case for three to five days if volume cools.
Bearish Scenario
Trading below the trendline and $12.822 could expose $12.090 within a week. A reclaim of the $13.50 zone would cancel that.
$LINK Price Prediction for October 2026
Bulls need $14.652 before month end, roughly 9.7% higher. Bears need a loss of $12,090. And Oct 29 brings Link:NYC into play. The October 2026 price prediction covers the wider month.
What Could Change the Price Path
Institutional Catalysts
Institutional news keeps Chainlink in the conversation, as the DTCC Chainlink coverage showed.
Cross-Chain Infrastructure
Progress on CCIP, Chainlink's cross-chain messaging protocol, matters for adoption, per the CCIP vault adapters report.
Oracle Adoption
Oracle wins, like the Open USD oracle news can support sentiment.
Risks to the Chainlink Price Prediction
Market Risk
Speculative flows, tracked in meme coin market news, can pull money away from large altcoins.
Sentiment Risk
Sector rotation, including the trend in AI crypto news, can shift sentiment fast. And one heavy whale can reset the chart.
Final Takeaway
This Chainlink price prediction leans mildly bullish while $12.822 holds. Reclaiming the $13.50 zone would strengthen the case.
But a break under the trendline flips the script. Timing matters here.
Disclaimer: This article is for educational market analysis only and isn't financial advice. Crypto assets are highly volatile, and readers should research independently before trading.

















