Dogecoin Price Prediction: Can DOGE Reach $0.10 With EMAs Holding?


Dogecoin price prediction is drawing attention as DOGE approaches a key resistance zone, and the chart explains why. DOGE trades near $0.0958 after a 3.14% daily gain.
This whale claim breakdown covers the earlier swing.
Buyers hold control for now. Whether that lasts is the real question.
Dogecoin Price Today: Current Price and 24H Performance
As of October 5, 2026, 12:56 PM IST (07:26 UTC), Dogecoin price today sits at $0.09578, per CoinMarketCap live price data.
That's a 3.14% gain in 24 hours, inside a range of $0.09277 to $0.09736. DOGE ranks #11 by market cap.
But weekly numbers tell a softer story. Coinglass shows seven days at -1.38% and 30 days at +12.83%.
Mixed signals.
Trading Volume and Market Cap
Volume is the money changing hands in a day. $DOGE shows $886.64M over 24 hours, up 96.65%.
Market cap, which is price times circulating coins, sits at $16.46B. Volume to market cap reads 5.4%.
A near-doubling in activity matters.
Why Is Dogecoin Moving Today?
DOGE is up. Volume jumped. Shorts got squeezed.
Coinglass logged short liquidations (forced exits) of $1.05M over 24 hours, against $545.76K for longs. Shorts paid the price. Nearly twice what longs lost.
Fresh memecoin news updates may fill the gap.
Buyers and a short squeeze seem to be driving it.
Supply and Valuation
Circulating supply sits at 171.9B DOGE, matching total supply. Max supply is infinite.
Fully diluted value, meaning the market cap if every coin existed, also reads $16.46B.
Dogecoin Futures Data
Coinglass derivatives data shows $1.37B in 24-hour futures volume against $221.35M in spot.
Futures volume dwarfs spot. By roughly six times.
Open interest, the total value of open futures contracts, is $1.50B. Long/short ratios, which compare bullish and bearish accounts, range from 2.46 to 4.14, so most traders are betting up.
Crowded longs can fuel a rally. And they can feed a flush.
Dogecoin ETF
US spot $DOGE ETF products hold $16.20M in net assets as of October 2, 2026, per SoSoValue ETF flow data.
Cumulative net inflow is $15.59M, while October 2 daily flow was $0.00.
September headlines point to Bitwise winding down its fund. But DOGE ETF inflows barely register at 0.11% of market cap.
Tiny numbers. ETF demand isn't steering this market.
Dogecoin Technical Analysis: RSI and EMA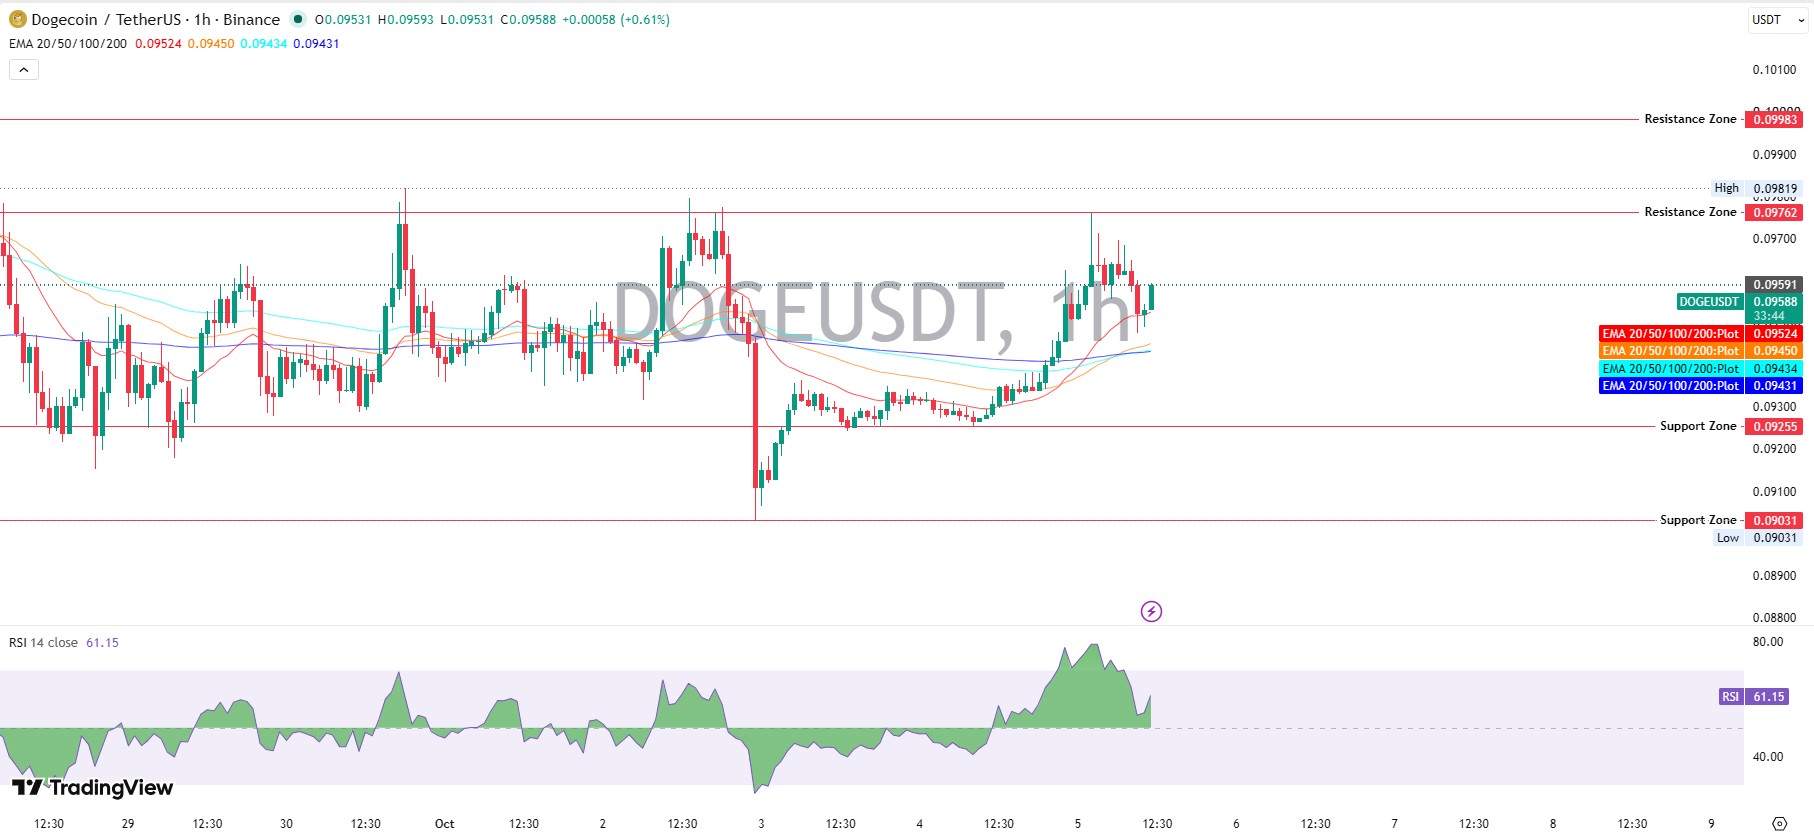
On the TradingView hourly chart for Binance DOGEUSDT, $DOGE technical analysis leans bullish for now.
Dogecoin RSI reads 61.15. That's strong without being overheated.
EMA means exponential moving average, a trend line that weights recent trades more. The 20, 50, 100, and 200 EMAs sit at $0.09524, $0.09450, $0.09434, and $0.09431.
Dogecoin EMA lines are stacked bullishly, with price at $0.09588 above all four.
That tight spread says the trend is young. Young and untested.
Key Support Levels
Support is a price floor where buyers tend to step in. The first floor sits at $0.09255, then $0.09031.
$DOGE support and resistance zones come straight from the chart.
The EMA cluster near $0.0943 adds a softer cushion. But lose $0.09255, and the bounce is in trouble.
Key Resistance Levels
Resistance is a ceiling where sellers show up. The first ceiling is $0.09762, then $0.09983, just under $0.10.
A recent high printed at $0.09819. Earlier ETF surge analysis covers a prior push to highs.
Resistance at $0.09762 feels heavy, though on second thought, ceilings often weaken after repeated tests.
Timing matters here.
Dogecoin Bullish Scenario
$DOGE bullish outlook needs trading above $0.09762 with strong volume. Then the $DOGE price target shifts to $0.09983, followed by the $0.10 round number.
So can $DOGE reach $0.10?
A prior 0.11850 breakout study covers a higher level. A drop under $0.09431, the 200 EMA, would void the setup.
$DOGE Base Scenario
The base case is chop. DOGE ranges between $0.09255 and $0.09762 while volume cools.
$DOGE short-term outlook stays sideways with a bullish tilt. Broader AI crypto news coverage can flag catalysts that break the range.
$DOGE Bearish Scenario
$DOGE bearish outlook begins with rejection at $0.09762, then a slide through $0.09255.
The next stop would be $0.09031. Fading volume would back that case.
Exchange listing updates matter here too, since liquidity shifts can hit price fast.
But the bigger picture is already bruised: down 18.41% this year and 61.86% over one year.
What Could Change the Outlook?
Volume spikes, ETF flows, and liquidation clusters can flip the setup fast.
Scheduled events matter too, and a coin events calendar keeps them in one place.
Dogecoin Price Prediction for October 2026
This Dogecoin price prediction leans on levels, not hype, so the $DOGE price prediction October 2026 range splits three ways. Any $DOGE price forecast here stays conditional.
Other coin outlooks sit in the price prediction hub.
Bull Case
Trading above $0.09762 and holding could send DOGE toward $0.09983 this month. Slipping under $0.09431 would cancel it.
Base Case
A range from $0.09255 to $0.09762 stays likelier if volume cools.
Bear Case
A break below $0.09255 could drag the price toward $0.09031 fast. Momentum would flip.
Dogecoin Long-Term Price Outlook
$DOGE long-term price prediction work is murky. Price sits 87.09% below the $0.7376 peak from May 8, 2021.
$DOGE price prediction 2026 can't ignore a year-to-date drop of 18.41%, though 90 days shows +24.96%.
Any DOGE price prediction beyond $0.10 is guesswork. Patient holders often track crypto airdrop opportunities meanwhile.
Key Levels to Watch
Breakout Confirmation
Trading above $0.09762 on rising volume would confirm a $DOGE breakout. Without it, any $DOGE rally stays unproven.
Breakdown Risk
A slide below $0.09431, then $0.09255, would confirm weakness. And $0.09031 becomes the target.
Risks That Could Change the $DOGE Price Prediction
Crowded longs can unwind quickly. ETF demand is tiny. Bitcoin direction wasn't part of this data set, so broader market swings remain a wildcard.
And attention can drift toward new memecoin presales when fresh stories appear.
Final Takeaway
This Dogecoin price prediction settles on a bullish short term and a damaged long term.
Price above all four EMAs, an RSI of 61.15, and nearly doubled volume back the bounce. Yet $0.09762 still decides the next move.
One level. That's the whole story right now.
Disclaimer: This article is for information only and isn't financial advice. Crypto prices swing hard, and no price level is guaranteed. Readers should research independently before trading.








.webp)








