Dogecoin Price Prediction: DOGE’s 2020 Repeat Could Shock the Market!


A trader says DOGE has been in a downtrend for almost two years and looks like the 2020 cycle before it broke out. Is that setup repeating? The daily chart does not show a breakout.
DOGE is down 2.12% today, stuck under the 20 EMA and inside a falling channel. This Dogecoin Price Prediction covers the claim, the Fed hold, liquidations and the chart.
Market data checked on October 29, 2026, at 10:07 IST.
Why is the Dogecoin price down today?
The dogecoin price today is down 2.12% to $0.07808 in 24 hours, underperforming a broadly weaker crypto market primarily driven by macro-driven risk aversion spilling over from Bitcoin.
Primary reason: Broader market sell-off driven by macro fears over oil prices and Fed policy, with Dogecoin moving as a high-beta asset.
Secondary reasons: Sector rotation away from altcoins and a technical breakdown below key moving averages.
Dogecoin News: 2020 Cycle Comparison
DOGE has been in a downtrend for almost two years and looks like the 2020 cycle before it broke out and went parabolic. A parabolic move is a steep, accelerating rise.
The post shows no chart or levels. The daily chart here starts in August, so CoinGabbar could not verify the two-year claim.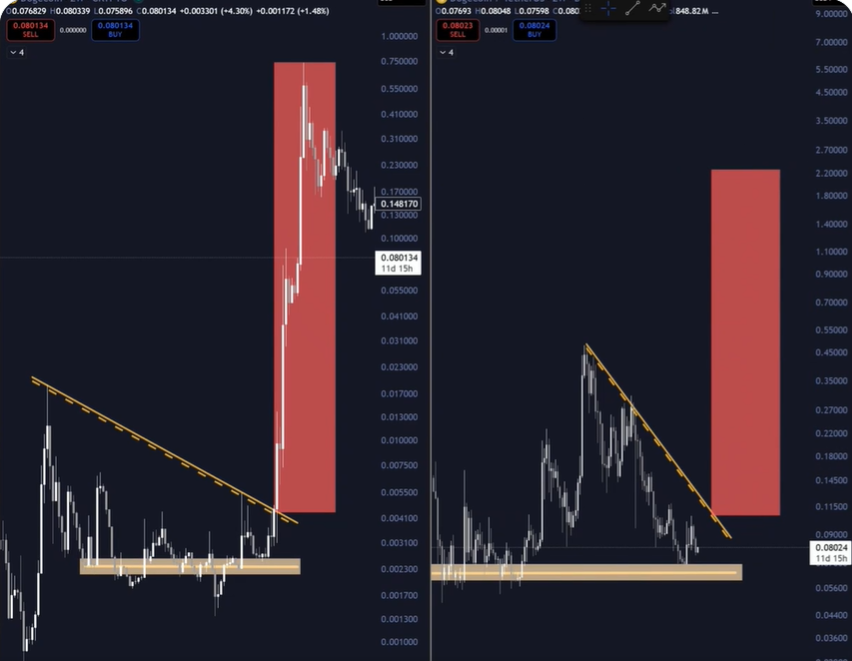
Source: Data From X
FOMC Update: Fed Holds Rates
The Fed held its rate at 3.75%–4.00% on October 28 in a 10–2 vote, with two officials wanting a quarter-point hike. Higher rates can weigh on risk assets such as DOGE. This data cannot link today's drop to the Fed.
Crypto News Today: DOGE Liquidation Data
A liquidation happens when an exchange force-closes a leveraged trade because the trader can no longer cover losses. Longs bet on a rise, and shorts bet on a fall. Coinglass shows:
Window | Total Liquidated | Long | Short |
4h | $956.37K | $902.05K | $54.32K |
24h | $2.46M | $1.35M | $1.10M |
Longs took about 55% of the $2.46M liquidated over 24 hours but about 94% of the 4-hour total. Longs lose when the price falls, so recent selling hit long traders hardest.
Dogecoin Forecast: Chart Analysis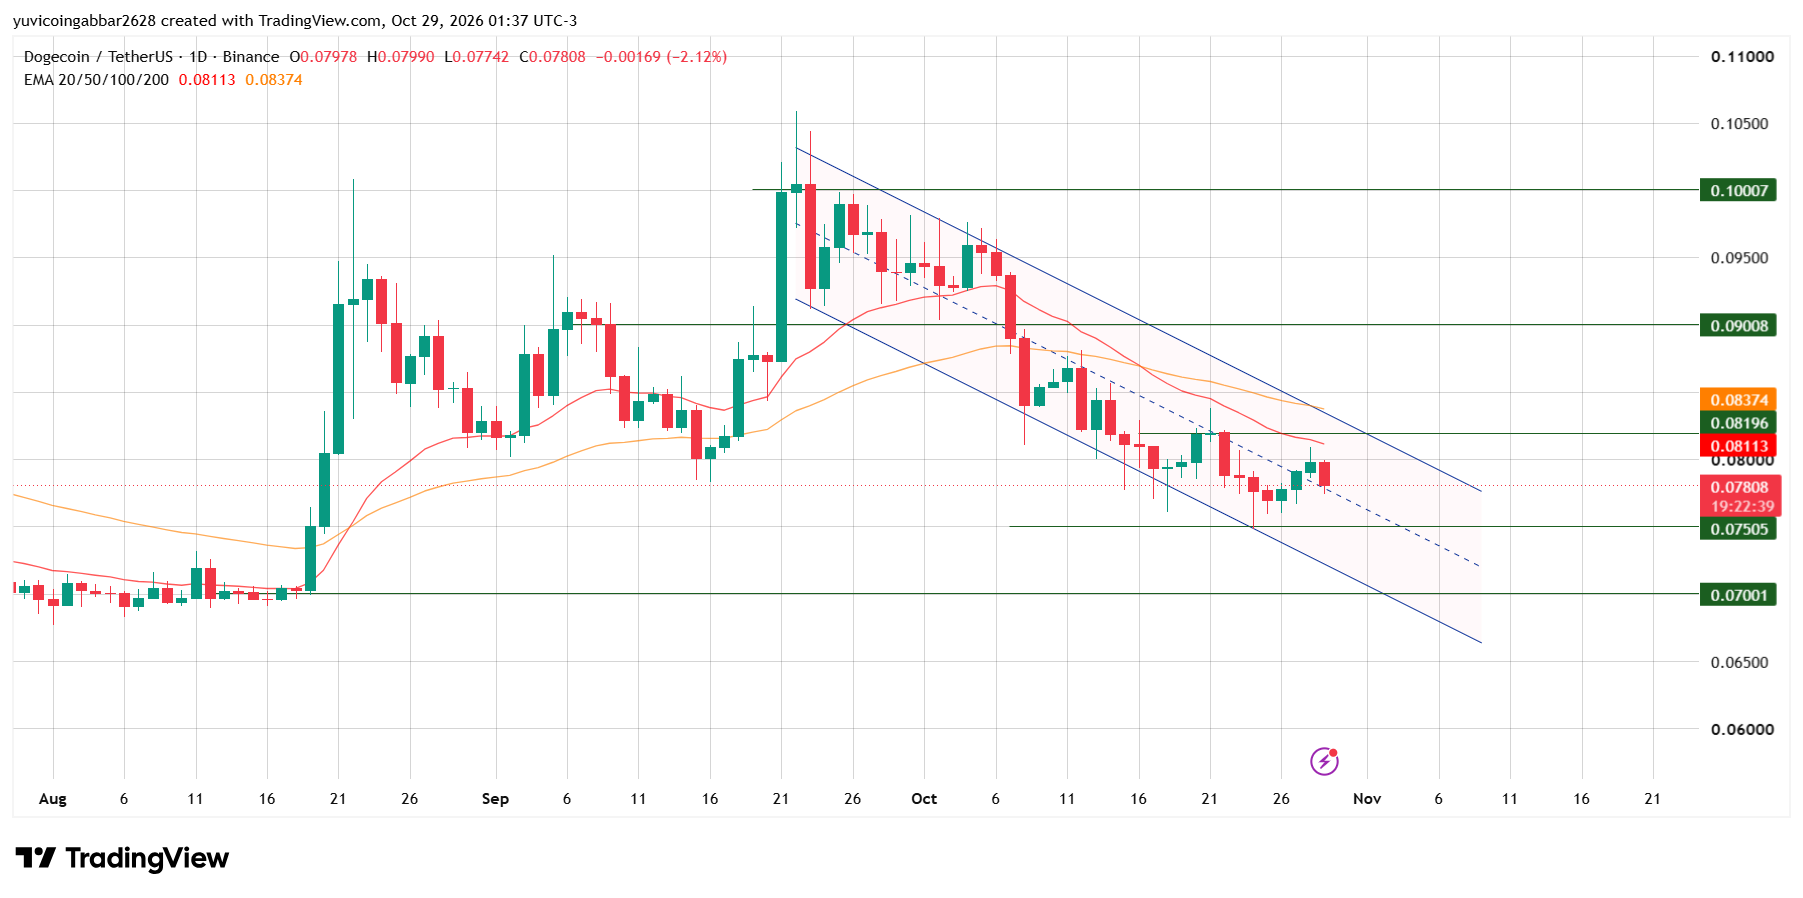
DOGE rose from about $0.07 in August to near $0.10007 on September 22. It has since moved lower inside a falling channel, a pair of downward-sloping boundaries that hold price in a range. Rallies in October failed near $0.08196, and the price dipped to the $0.07505 level.
An EMA, or exponential moving average, weights recent prices more heavily. The chart shows the 20 and 50 EMAs. Both slope down and sit above price, and the 20 EMA $0.08113 is below the 50 EMA $0.08374, a bearish order.
A bounce on October 28 reached the 20 EMA $0.08113 but stalled just under it.
Dogecoin Forecast: Support and Resistance Levels
Type | Level |
Highest marked level | $0.10007 |
Resistance 2 | $0.09008 |
Resistance 1 | $0.08196 |
Immediate support | $0.07505 |
Deeper support | $0.07001 |
Bull case: A daily close above the 20 EMA at $0.08113 and then $0.08196 would put the 50 EMA at $0.08374 in play.
Bear case: If $DOGE closes below $0.07505, about 4% lower, the price could slide toward $0.07001.
DOGE Scenarios and Invalidation (October 29, 2026)
Scenario | Trigger | Likely Outcome | Invalidation |
Bull | Close above $0.08196 | Move toward $0.08374, then $0.09008 | Close below $0.07505 |
Base | Range of $0.07505 to $0.08113 | Sideways inside the channel | Break of either level |
Bear | Close below $0.07505 | Slide toward $0.07001 | Close back above $0.07505 |
Dogecoin Price Prediction 2026: Can $DOGE Reach $0.10007?
It would take a gain of about 28% from $0.07808. Any DOGE prediction toward that level needs more than a cycle story, since $DOGE must leave the channel and clear both EMAs, $0.08196 and $0.09008 first.
Dogecoin Price Prediction: Expert View
The 2020 comparison needs a breakout, and the chart shows none. Price is under both EMAs and inside a falling channel, so the setup stays cautious.
A December hike is still possible, so risk assets may stay sensitive to rate news. The level to watch is $0.07505. A daily close below it would open $0.07001, while a close above $0.08196 would be the first real sign of strength.
Disclaimer
This article is for informational purposes only and isn't financial advice. Crypto markets are volatile. Always do your own research before making any trading decisions involving DOGE.



















