Dogecoin Price Prediction November 2026: Can DOGE Hit a New High 2026?


One post says a meme supercycle will send DOGE up 10X. Another says spot Dogecoin ETFs are shrinking. Can $DOGE really hit 10X? Nothing on the chart points that way today.
A 10X move from $0.07726 means about $0.7726, and the price still sits under all four trend EMAs. This Dogecoin Price Prediction November 2026 checks both posts against the liquidation data and the 4-hour chart, then lists the levels to watch.
Market data checked on October 26, 2026, at 11:33 IST.
Dogecoin Prediction Today: Market Overview
Metric | Value |
Price (TradingView OKX 4H chart) | $0.07726 |
24 hr Change | +1.23% |
Candle Open | $0.07633 |
Candle Range | $0.07629 – $0.07736 |
Dogecoin News Today: Spot ETFs Lose Nearly $540K
A news post on X says spot Dogecoin exchange-traded funds (ETFs) lost nearly $540K over the past week. An ETF is a fund that trades on a stock exchange like a share.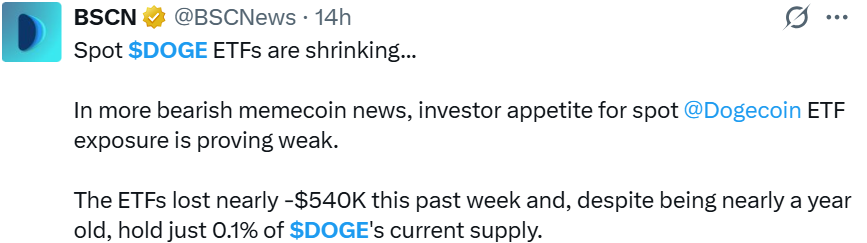
Source: Data From X
The post adds that the funds are almost a year old and hold only 0.1% of DOGE's current supply. CoinGabbar could not verify the figures.
DOGE News: 10X and Third-Cycle Claims
A post on X, account not shown, says a meme supercycle will send $DOGE 10X. It gives no timeline, chart or method, so it reads as opinion.
A second post shows a 2-week chart and says Dogecoin's third cycle repeats the first. CoinGabbar could not verify the comparison, and a 4-hour chart cannot show it.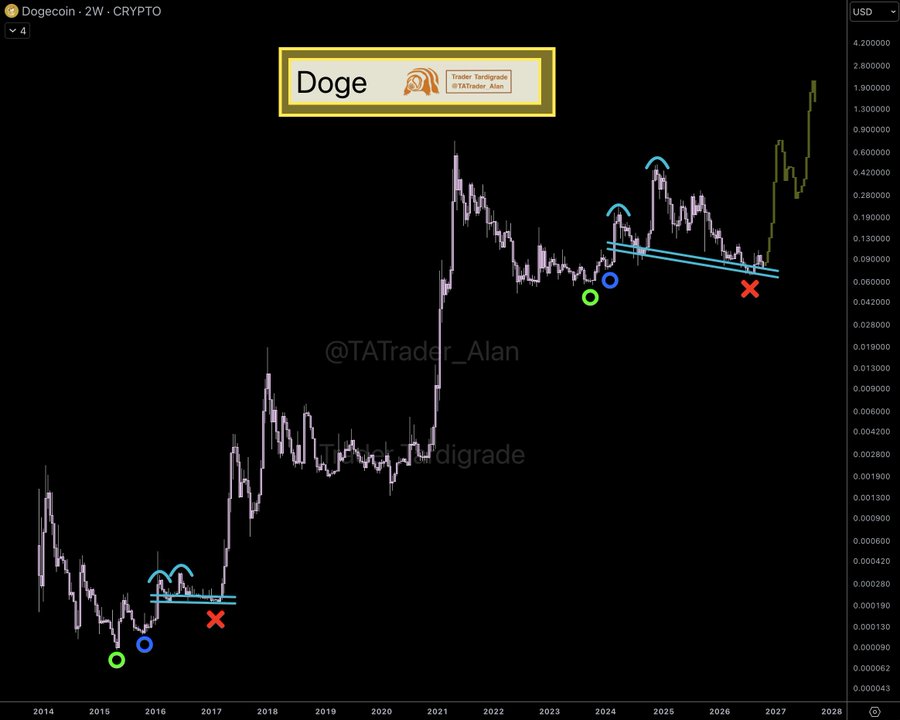
DOGE Price Outlook: DOGE Liquidation and Futures Volume
A liquidation happens when an exchange force-closes a leveraged trade because the trader can no longer cover losses. Longs bet on a rise, and shorts bet on a fall. Coinglass shows:
Window | Total Liquidated | Long | Short |
12h | $384.71K | $276.39K | $108.33K |
24h | $696.42K | $455.05K | $241.37K |
Source: Data From CoinGlass
Longs took about 65% of the $696.42K liquidated over 24 hours and about 72% of the 12-hour total.
Coinglass futures volume leads with Binance at $238.13M, OKX at $138.96M, Gate at $99.59M, MEXC at $77.07M and Bybit at $42.66M. The screenshot gives no time window.
Dogecoin Price Prediction: $DOGE Holds a Support Under EMAs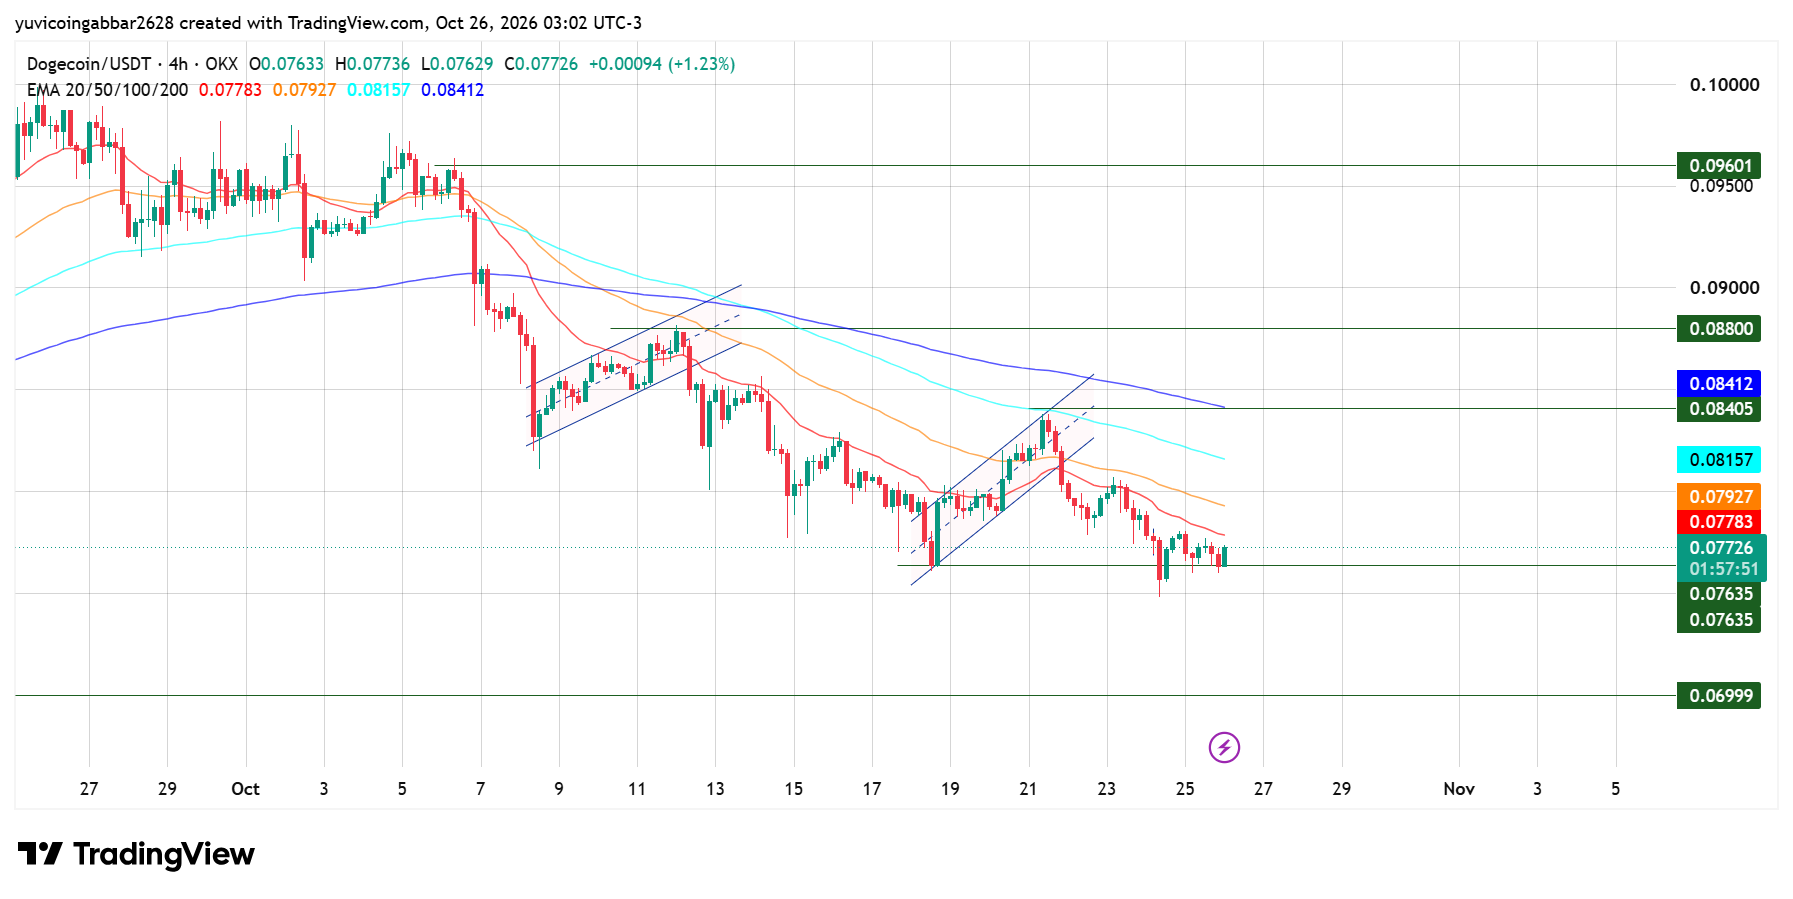
A rising channel is a pair of upward-sloping trend lines and a channel pattern that holds the price in a range. DOGE broke down from two such channels, one in early October and one from October 18 to 22.
It has since slid to a support at $0.07635. The latest candle opened at $0.07633, ranged from $0.07629 to $0.07736 and printed $0.07726.
The overall trend remains bearish as long as price trades below the key EMAs. Bulls need to reclaim all the major moving averages and hold above them to confirm a trend reversal. Until then, rallies are likely to face selling pressure near these EMA levels.
EMA | Value | Position vs Price |
EMA 20 (red) | $0.07783 | Above price |
EMA 50 (orange) | $0.07927 | Above price |
EMA 100 (cyan) | $0.08157 | Above price |
EMA 200 (blue) | $0.08412 | Above price |
Dogecoin Forecast: Support and Resistance Levels
Type | Level |
Highest marked level | $0.09601 |
Resistance 2 | $0.08800 |
Resistance 1 | $0.08405 |
Immediate support | $0.07635 |
Deeper support | $0.06999 |
Bull case: A 4-hour close above the EMA 20 at $0.07783 and then the EMA 50 at $0.07927 would open the way to $0.08405, near the EMA 200.
Bear case: If $DOGE closes a 4-hour candle below $0.07635, the price could slide about 9% toward $0.06999.
DOGE Scenarios and Invalidation (October 26, 2026)
Scenario | Trigger | Likely Outcome | Invalidation |
Bull | 4-hour close above $0.07927 | Move toward $0.08157, then $0.08405 | Close below $0.07635 |
Base | Range of $0.07635 to $0.07783 | Sideways under the EMAs | Break of either level |
Bear | 4-hour close below $0.07635 | Slide toward $0.06999 | Close back above $0.07635 |
Dogecoin Price Prediction November 2026: Can Dogecoin Reach $0.09601?
It would take a gain of about 24% from $0.07726. Any DOGE price prediction near that level needs more than headlines, since $DOGE must clear all four EMAs, $0.08405 and $0.08800 first.
Dogecoin Price Prediction: Expert View
Price sits just above $0.07635 and under all four EMAs, so the setup stays cautious until $DOGE closes above $0.07927.
Disclaimer
This article is for informational purposes only and isn't financial advice. Crypto markets are volatile. Always do your own research before making any trading decisions involving DOGE.

















