Polkadot Price Prediction: Can $DOT Explode After the FOMC Meeting?


Polkadot just set a number no other major chain can touch. BSCNews flagged that DOT's Nakamoto Coefficient of 178 crushes TON's 88 and Avalanche's 24, and Polkadot itself dropped fresh news on JAM heading into 2027 production.
This Polkadot price prediction breaks down the DOT price target 2026 chatter, the decentralization record, and whether the chart is ready to follow.
Market data was checked on September 16, 2026, at 11:12 UTC.
Polkadot Price Prediction Today: Market Overview
Metric | Value |
Price | $0.94895 |
24h Change | -4% |
Market Cap | $1.61B |
Unlocked Mkt Cap | $1.65B |
FDV | $1.98B |
24h Volume | $139.22M |
Vol/Mkt Cap (24h) | 8.61% |
Total Supply | 1.7B |
Max Supply | 2.1B |
Circulating Supply | 1.7B |
Source: Data from CoinMarketCap as of September 16, 2026, at 11:21 IST. Figures may vary slightly across other tracking websites.
Polkadot News Today: $DOT Nakamoto Coefficient Hits Record 178
In today's Polkadot News, @BSCNews reported that Polkadot set the highest Nakamoto Coefficient (a measure of how many independent actors would need to cooperate to attack a network) benchmark for decentralization at 178.
Source: Data From X
The post noted TON Blockchain and Avalanche trail far behind at 88 and 24, respectively, calling it proof of Polkadot's consistently decentralized validator set.
Polkadot JAM Update: Parachain Migration Roadmap for 2027
@Polkadot's official account confirmed that Parity Technologies is migrating Parachain functionality to a JAM (Join-Accumulate Machine, the network's next-generation execution environment) service, with production targeted for 2027.
Source: @Polkadot's official account
A quoted post from Bill Laboon of the Web3 Foundation added that the move shifts parachain finality to JAM and reduces reliance on Relay Chain services, with updates to follow on the Polkadot Forum.
DOT Technical Analysis: Price Chart and EMA Levels
Pair: DOT/USD · Market: Spot (Crypto) · Timeframe: 4H · Source: TradingView · Timestamp: September 16, 2026, 02:12 UTC-3
DOT is trading at $0.94895, down 4% on the candle, sliding inside a descending channel that has held since September 8.
The DOT EMA levels sit well above price, with the EMA 20 at $0.99305 and EMA 50 at $1.01153 acting as resistance, while a shaded support zone near $0.90052, marked "IMP Support" on the chart, sits just below the current price.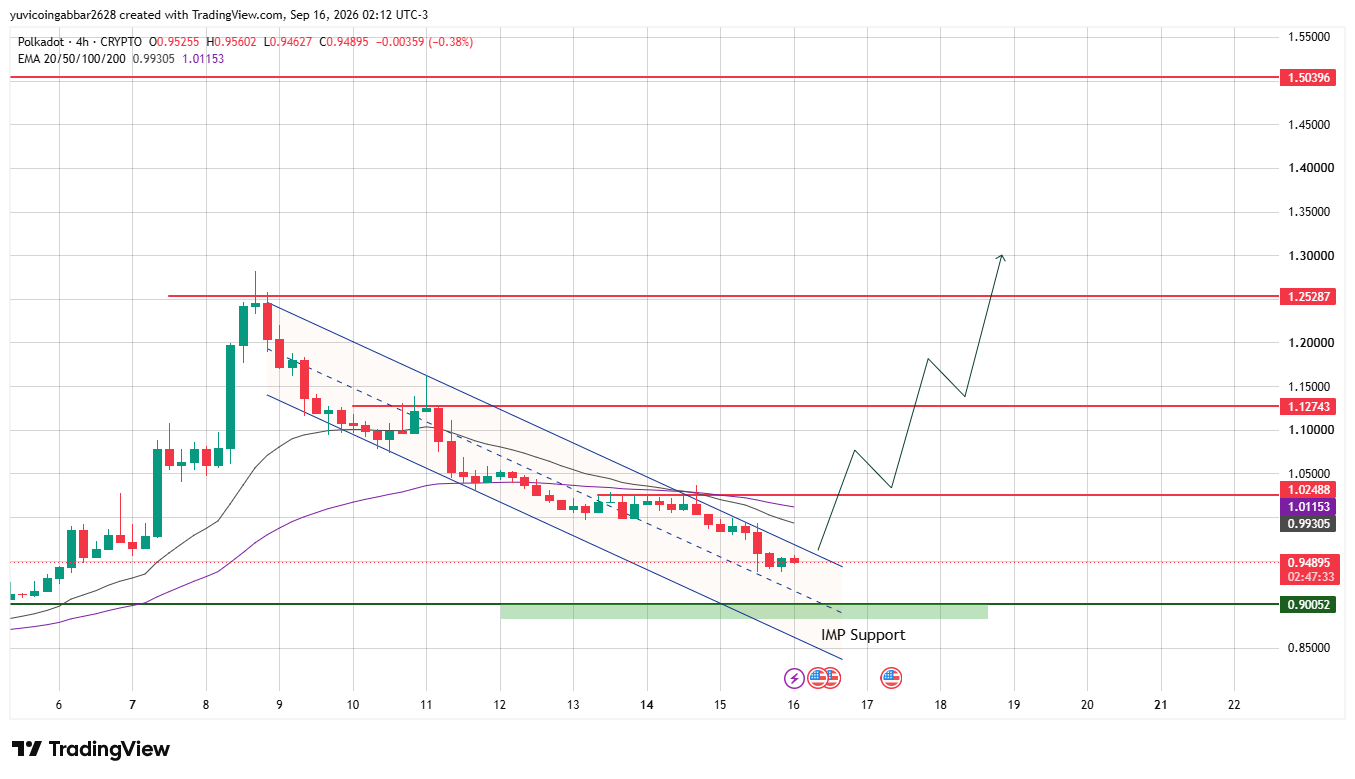
DOT Support and Resistance Levels: Polkadot Forecast Zones
Level Type | Price |
Resistance 3 | $1.50396 |
Resistance 2 | $1.25287 |
Resistance 1 (nearest) | $1.12743 |
Immediate Price Reference | $0.94895 |
EMA 20 (near resistance) | $0.99305 |
EMA 50 (near resistance) | $1.01153 |
Support Zone (IMP Support) | $0.90052 |
Polkadot Forecast: Bull Case vs Bear Case
Bull case: Holding the IMP Support zone near $0.90052 keeps the channel breakout setup intact, and reclaiming the EMA cluster at $0.99305 to $1.01153 would open the path toward $1.12743 and eventually $1.25287.
Bear case: Losing the $0.90052 support zone would put the channel structure at risk and expose the price to further downside before any recovery attempt.
A break below that zone with no quick reaction would suggest sellers remain in control.
Triggers & Invalidation
Scenario | Trigger | Likely Outcome | Invalidation Point |
Channel breakout | Holds above $0.90052 support zone | Push toward EMA cluster $0.99305–$1.01153 | Close below $0.90052 |
EMA reclaim | Clears $0.99305–$1.01153 | Move toward $1.12743 | Rejection at EMA cluster |
Channel breakdown | Loses $0.90052 IMP Support | Deeper pullback | Structural zone lost |
Polkadot Price Prediction: Can DOT Reach $1.50396?
$1.50396 is the highest resistance level marked on the chart. Reaching it would require DOT to first reclaim the EMA cluster near $0.99305 to $1.01153, then clear $1.12743 and $1.25287, a multi-stage recovery rather than a single move.
Polkadot Price Prediction 2026: Expert View
According to CoinGabbar analysts, The decentralization record and the JAM roadmap give Polkadot a strong long-term narrative, but the chart still shows DOT stuck inside a descending channel below its EMAs.
The $0.90052 support zone is the level that matters most right now: losing it would undercut the bullish story even as the fundamentals improve.
Disclaimer
This piece is for informational purposes only and isn't financial advice. The levels and scenarios above are based on technical chart analysis and publicly available data at the time of writing, and crypto markets can move sharply within hours, so past patterns don't guarantee future outcomes. It's worth doing independent research and considering your own risk tolerance before acting on any of the levels discussed here.













.jpg)




