Ethena Price Prediction: $ENA New High $0.30 Soon? IMP Breakout!


Ethena just handed sellers one less reason to dump, and the chart is already showing it.
$ENA broke out of a months-long slide, the team fast-tracked its token unlock schedule to cut future sell pressure, and one trader is calling this the last chance to catch the next major move before a run toward new highs.
This Ethena Price Prediction looks at whether the breakout has room left to run.
Market data was checked on September 2, 2026, at 11:47 AM IST.
Ethena Price Prediction Today: Market Overview
| Metric | Value |
| Price | $0.15777 |
| 24h Change | +3% |
| Market Cap | $1.56B |
| Unlocked Market Cap | $1.57B |
| FDV | $2.38B |
| 24h Volume | $830.1M |
| Vol/Mkt Cap (24h) | 53.05% |
| Liq/Mkt Cap | 0.11% |
| TVL | $4.65B |
| Market Cap/TVL | 0.3373 |
| Total Supply | 15B ENA |
| Max Supply | 15B ENA |
| Circulating Supply | 9.82B ENA |
| Holders | 98.81K |
Source: Data from CoinMarketCap as of September 2, 2026, at 11:47 AM IST. Figures may vary slightly across other tracking websites.
$ENA Crypto News Today: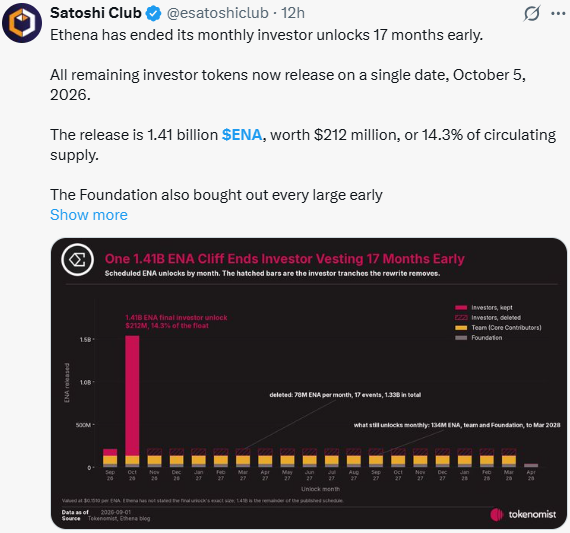
According to a post from X, Ethena has ended its monthly investor unlock schedule 17 months ahead of plan.
All remaining investor tokens now release on a single date, October 5, 2026, covering 1.41 billion ENA, worth about $212 million and 14.3% of circulating supply.
The post adds that the Foundation bought out early investors who had been selling and that Team and Foundation vesting continues after October at roughly 134 million ENA a month through March 2028.
CoinGabbar could not independently verify these figures beyond what was shared in the post.
ENA Price Prediction Chart: Technical Analysis
Pair: ENA/USD · Market: Spot (Crypto, aggregated) · Timeframe: 1D · Source: TradingView · Timestamp: September 2, 2026, 11:47 UTC+5:30
Ethena trades at $0.15777 after breaking out of a descending trendline that had capped the price since early 2026.
$ENA spent months building a base between roughly $0.08 and $0.10 before a sharp breakout candle in late August pushed price through that trendline and above the $0.1454 level.
ENA is now consolidating between $0.1454 and $0.17154, the zone marking the pause after the initial pump, with $0.17154 the immediate resistance to clear for the next leg higher.
RSI reads 65.70, with its signal average at 74.14. Both sit in bullish territory but off the extreme highs from the initial breakout spike, pointing to a cooling-off period rather than a reversal.
The EMA cluster sits well below current price, with EMA 20 at $0.13735 and EMA 50 at $0.11476, both now acting as support if the consolidation runs deeper.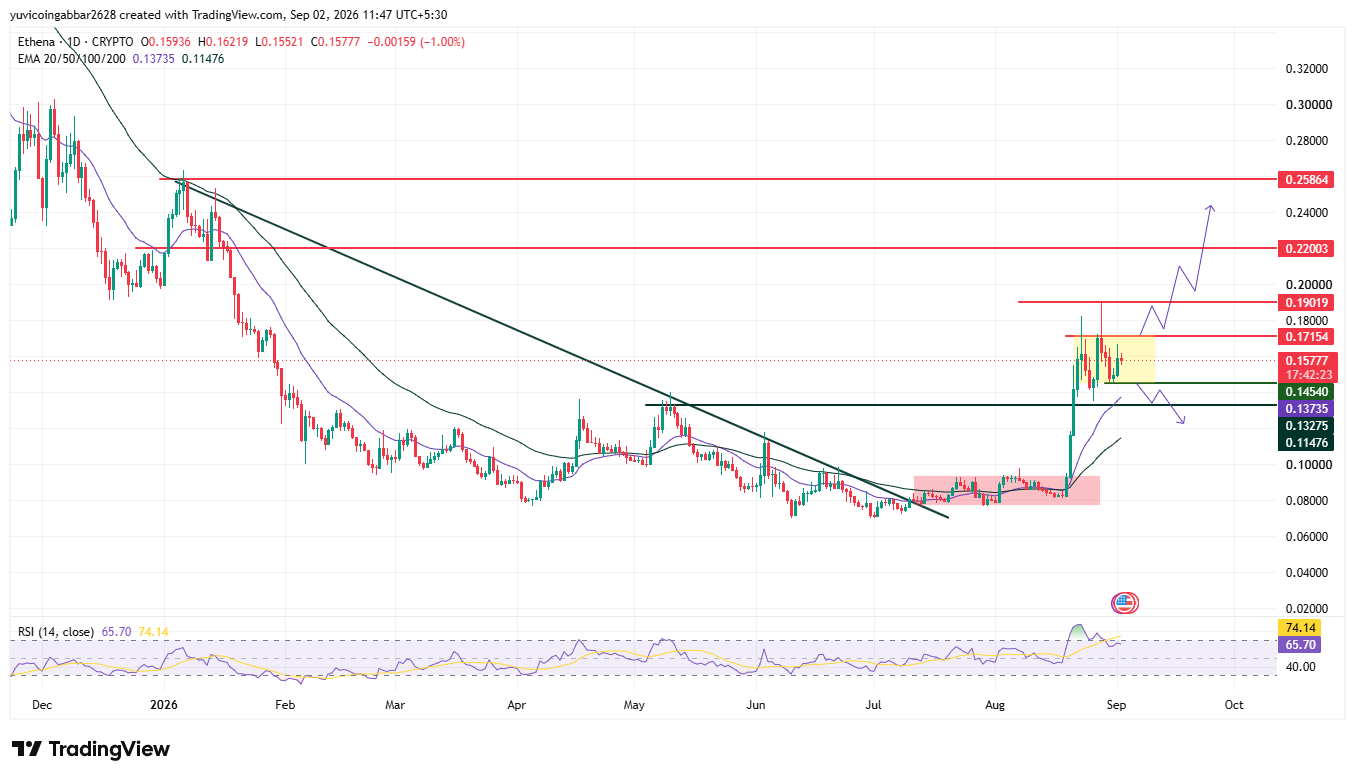
Ethena Price Prediction 2027: Key Levels
| Level Type | Price |
| Resistance 4 | $0.25864 |
| Resistance 3 | $0.22003 |
| Resistance 2 | $0.19019 |
| Resistance 1 (nearest) | $0.17154 |
| Immediate Price Reference | $0.15777 |
| First Support | $0.14540 |
| Secondary Support | $0.13275 |
Ethena Forecast: Bull Case vs Bear Case
Bull case: Holding above the first confirmed support at $0.1454 keeps the breakout structure intact.
A confirmed close above $0.17154 would open the path toward $0.19019 and $0.22003, with $0.25864 in view if the broader ENA price prediction for 2026 plays out.
Bear case: A break below $0.1454 would put the breakout in question, with EMA 20 at $0.13735 and the secondary support at $0.13275 as the next levels down.
Losing EMA 50 at $0.11476 would undermine the recovery structure.
Ethena Price Prediction Long-term: Double Bottom Breakout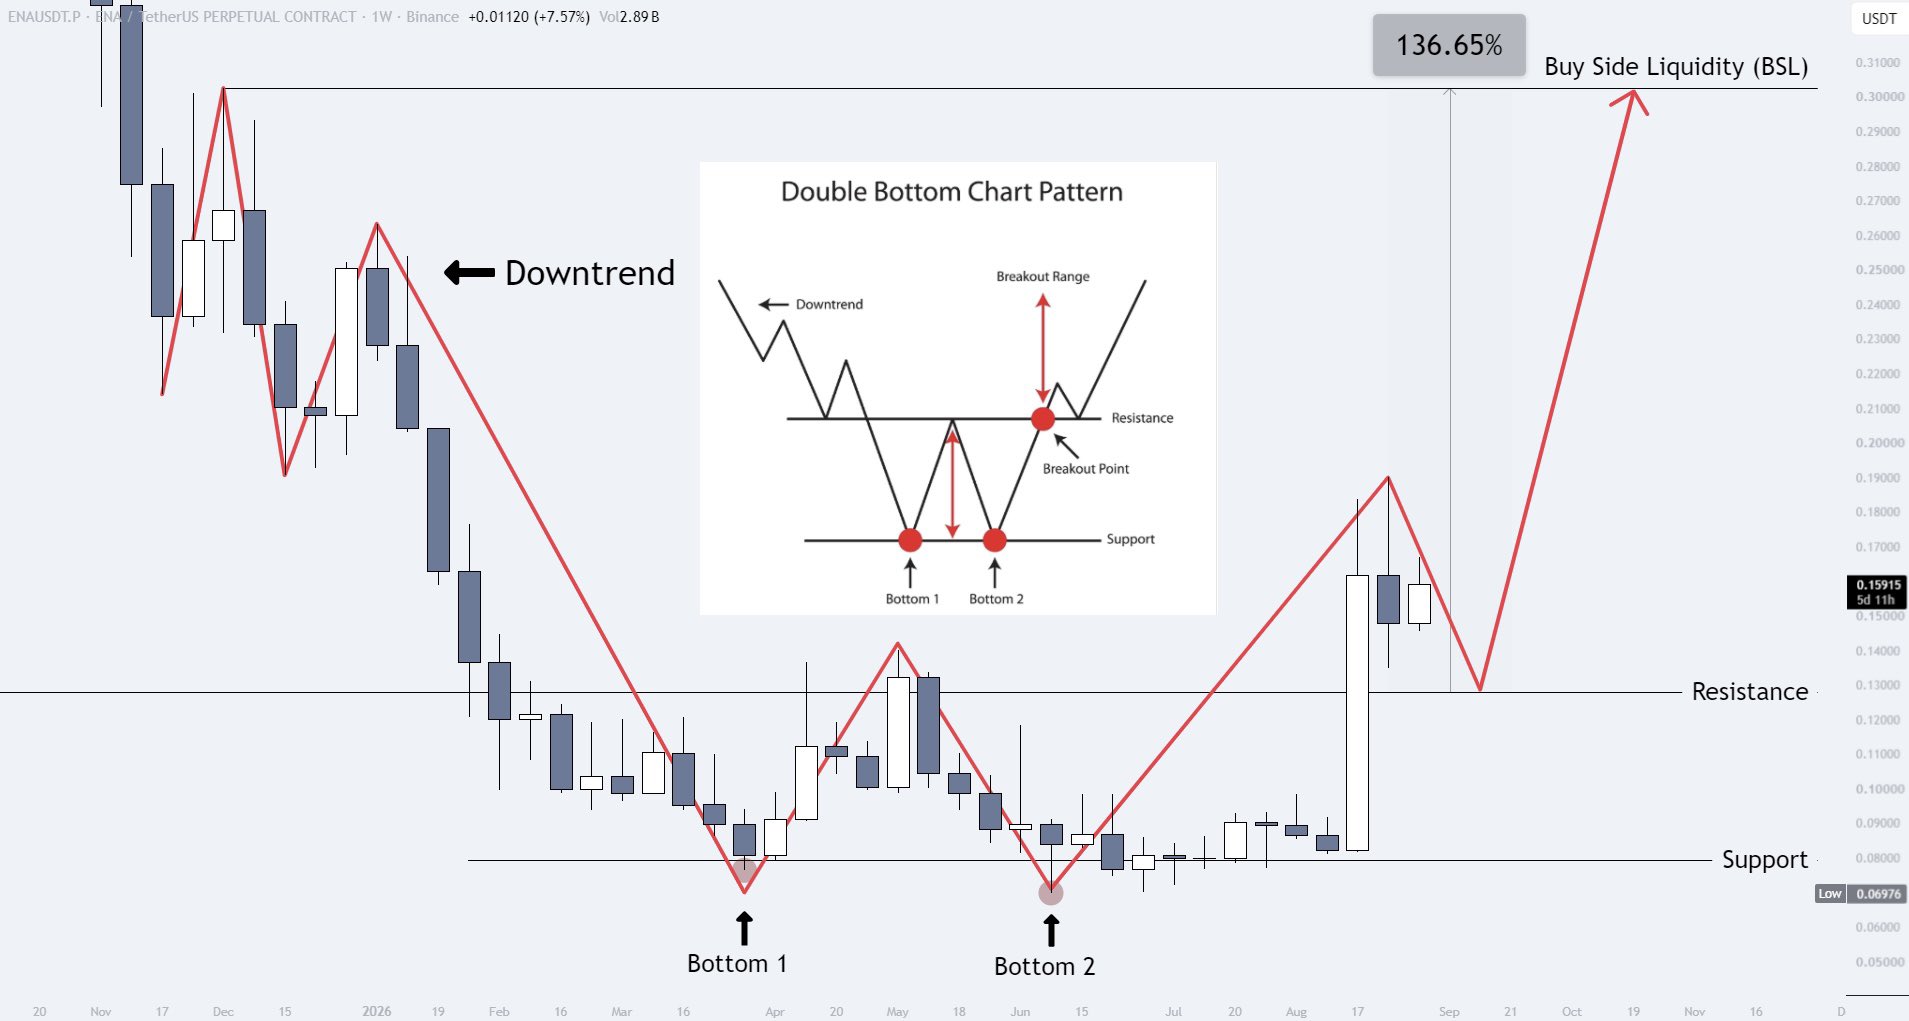
A post from a trader pointed to a double bottom pattern on the ENA chart, with the price already breaking above the pattern's key level.
The post flagged a possible retest near $0.13, a mid-term target near $0.30, and a longer-term call toward a new ENA all-time high, with $1.50 mentioned as a global-timeframe target if momentum builds.
CoinGabbar could not independently verify these targets, and they reflect one trader's personal view rather than confirmed data.
$ENA Price Scenarios: Triggers and Invalidation
| Scenario | Trigger | Likely Outcome | Invalidation Point |
| Breakout continuation | Daily close above $0.17154 | Move toward $0.19019, with $0.22003 as extended target | Rejection and close back below $0.17154 |
| Range hold | Price stays between $0.1454 and $0.17154 | Sideways consolidation before the next directional move | Break outside either boundary |
| Support retest | Pullback to $0.13735 (EMA 20) or $0.13275 | Bounce off support, structure stays bullish | Daily close below $0.11476 (EMA 50) |
Can Ethena ($ENA) Reach $0.25864?
$0.25864 is the highest resistance level marked on the $ENA chart.
Reaching it would require $ENA to first clear $0.17154, then $0.19019 and $0.22003 in sequence, a multi-stage move rather than something likely in a single leg.
Ethena Price Prediction: Expert View
According to CoinGabbar analysts , ENA's break above its multi-month downtrend, paired with the accelerated unlock timeline, points to lighter overhead sell pressure than earlier in 2026.
$0.1454 is the level that keeps the breakout structure intact, and $0.17154 is what needs to break for the next leg higher.
Ethena Price Prediction: Data Sources
Price and technical levels referenced from a 1D $ENA/USD chart via TradingView, timestamped September 2, 2026, 11:47 UTC+5:30. Market cap, unlocked market cap, FDV, TVL, volume, and supply data referenced from CoinGecko. Social media context referenced from public posts on X.
Disclaimer
This article is for informational purposes only and does not count as financial advice. The levels and scenarios discussed above come from technical chart analysis and publicly available data at the time of writing, and crypto prices can shift quickly within a single session, so historical patterns do not guarantee what happens next. Readers should do their own research and weigh their own risk tolerance before making any decisions based on the levels covered here.
Also read:
















