Shiba Inu Price Prediction: SHIB Burn Spikes! Could Bulls Strike Next?


Shiba Inu just picked up an institutional headline, and a fresh burn update landed on the same day. Is $SHIB setting up for a comeback? The ETF link is unconfirmed, and the burn is tiny.
This Shiba Inu Price Prediction checks both claims against liquidation data and the daily chart, then lists the levels that matter next.
Market data checked on October 21, 2026, at 15:23 IST.
Shiba Inu Price Prediction Today: Market Overview
Metric | Value |
Price (OKX daily chart) | $0.000005183 |
24h Change (current daily candle) | +5% |
Candle Range | $0.000005099 – $0.000005191 |
Market Cap | $3,023,314,350 |
24h Volume | $47,991,117 |
Market Cap Rank | #37 |
Market cap, volume and rank come from a Shibburn hourly update posted about 8 hours earlier. It showed a price of $0.00000513, so it is slightly older than the chart price.
Why is SHIB’s price up today?
Shiba Inu price today is up 5% to $0.000005183 in 24h, outperforming a broader market rally, primarily driven by a positive reaction to an upcoming Binance policy change that enhances its collateral utility.
Primary reason: Anticipatory buying ahead of Binance increasing $SHIB's collateral ratio.
Secondary reasons: Broad market beta from a rising Bitcoin and improved technical momentum.
Shiba Inu News Today: SHIB Burn Rate Slows Sharply
A burn permanently removes tokens from supply by sending them to a wallet no one can use. Shibburn reports 111,395 SHIB burned in the past hour across 2 transactions.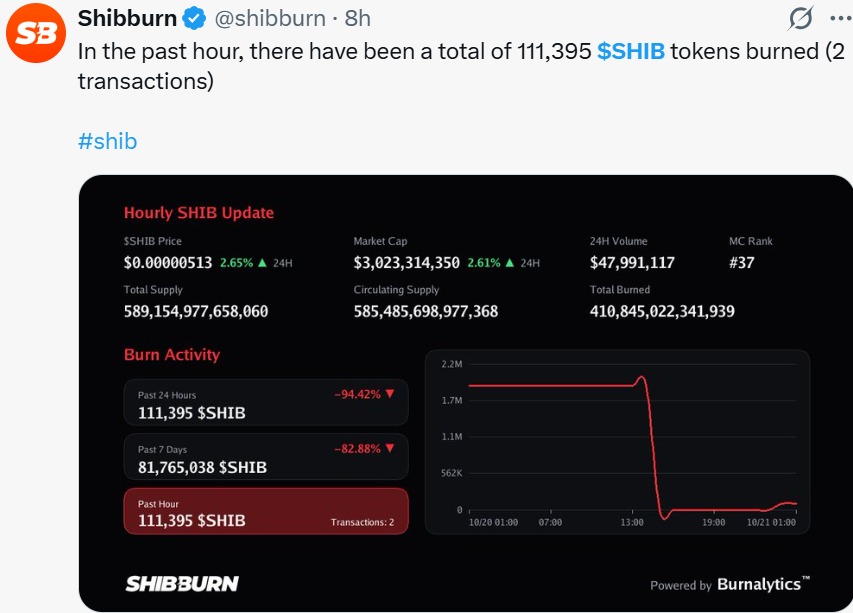
That is down 94.42% over 24 hours, and the 7-day total of 81,765,038 $SHIB is down 82.88%.
At the Shibburn price, the hourly burn is worth about $0.57, which is a very small share of the 585,485,698,977,368 SHIB in circulation. Total burned stands at 410,845,022,341,939 SHIB.
SHIB ETF Exposure: Multi-Asset Fund Is Not a Spot ETF
A post on X says T. Rowe Price's multi-asset crypto ETF was reported to include potential $SHIB exposure alongside major coins.
The post itself adds that this is not a dedicated SHIB spot ETF.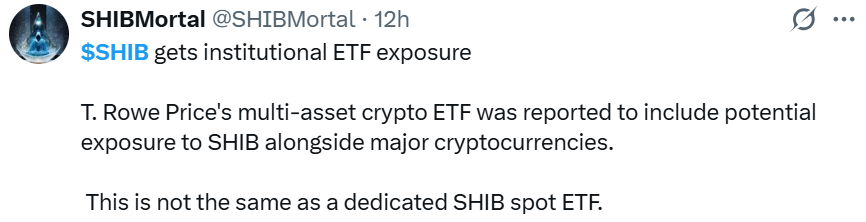
Source: Data From X
CoinGabbar could not independently verify the report, so it should be treated as unconfirmed.
SHIB News: SHIB Liquidation and Futures Volume
A liquidation happens when an exchange force-closes a leveraged trade after losses grow too large. Longs bet on a rise, and shorts bet on a fall. Coinglass shows:
Window | Total Liquidated | Long | Short |
1h | $204.69 | $0 | $204.69 |
4h | $240.59 | $0 | $240.59 |
12h | $240.59 | $0 | $240.59 |
24h | $26.22K | $701.05 | ~$25.52K |
Source: Data From CoinGlass
Shorts took roughly 97% of the 24-hour total, which hints at a small squeeze during the bounce.
Coinglass futures volume leads with OKX at $9.56M, then LBank at $7.91M, MEXC at $4.99M and WhiteBIT at $3.01M. The time window is not shown.
$SHIB Technical Analysis: Daily Chart Read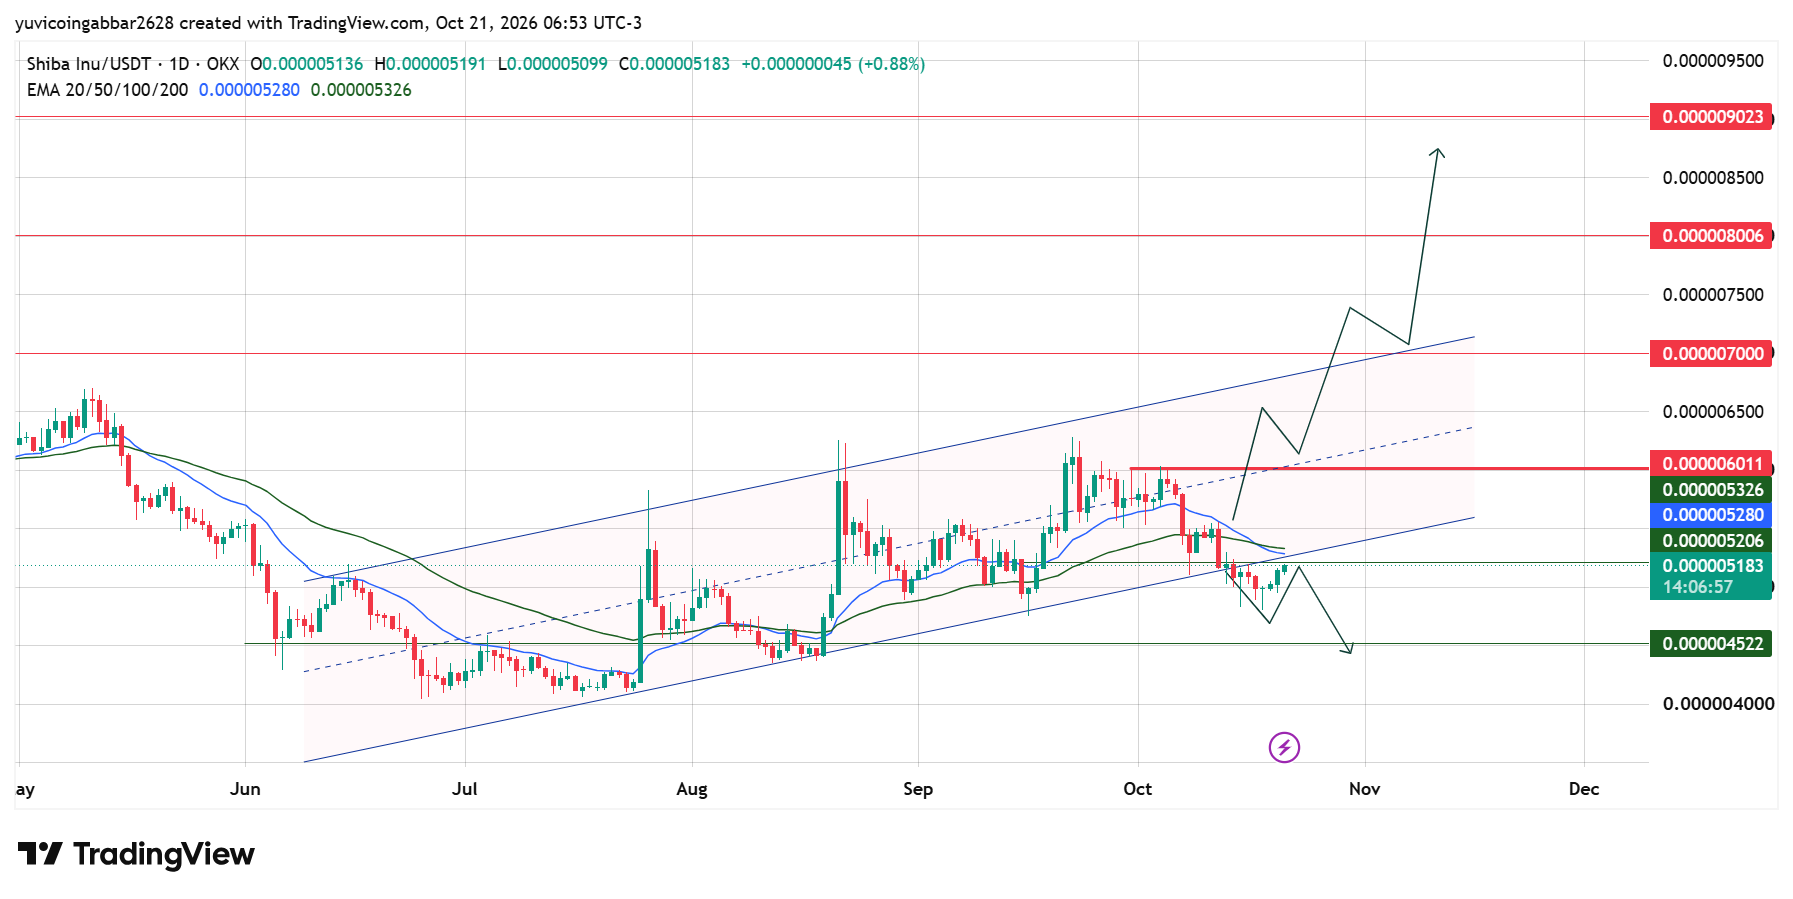
$SHIB has been trying to move inside of a rising channel. In October it slipped below the lower line and is now testing that line from underneath, at the same spot as the EMAs.
An EMA, or exponential moving average, is a trend line that weights recent prices more heavily.
It was looking like a pullback before the next rally. The EMA crossover between the 20 EMA ($0.000005280) and the 50 EMA ($0.000005326) is acting as a hurdle for the price to move in a bullish direction. Let’s see what’s next.
EMA | Value | Position vs Price |
EMA 20 (blue) | $0.000005280 | Above price |
EMA 50 (green) | $0.000005326 | Above price |
These lines act as near-term resistance. For the rally to continue, $SHIB needs to clear them and hold above its support.
Shiba Inu Forecast: Support and Resistance Levels
Type | Level |
Immediate price reference | $0.000005206 |
First confirmed support | $0.000004522 |
Resistance 1 | $0.000006011 |
Resistance 2 | $0.000007000 |
Resistance 3 | $0.000008006 |
Highest marked level | $0.000009023 |
Bull case: A daily close above $0.000005326 would put $SHIB back toward its channel, with $0.000006011 next.
Bear case: A rejection at the EMAs and channel line would point to $0.000004522.
SHIB Scenarios and Invalidation (October 21, 2026)
Scenario | Trigger | Likely Outcome | Invalidation |
Bull | Close above $0.000005326 | Move toward $0.000006011 | Close below $0.000005206 |
Base | Range between $0.000004522 and $0.000005326 | Sideways base | Break of either level |
Bear | Rejection at EMAs and channel line | Slide toward $0.000004522 | Close above $0.000005326 |
Can $Shiba Inu Reach $0.000009023?
It would take a gain of about 74% from $0.000005183, and $SHIB would need to pass each resistance level in order. A reported ETF link and a small burn cannot carry that move alone.
Shiba Inu Price Prediction: CoinGabbar Technical
The setup is cautious: the price sits under both EMAs and the lower channel line. A daily close above $0.000005326 would be the first sign of momentum.
Disclaimer
This article is for informational purposes only and isn't financial advice. Crypto markets are volatile. Always do your own research before making any trading decisions involving $SHIB.