Fed Rate Bets: Why Are Bitcoin, Ethereum and XRP Prices Falling Today?


The crypto market is under pressure before the Fed Rate decision on Wednesday, October 28. Total market value slipped 1.03% to about $2.66 trillion as traders cut risk.
Bitcoin lost the $80,000 level over the weekend.
Why Is the Crypto Market Down Today?
Coin | Price | Latest Move |
Bitcoin | Below $80,000 | Low near $79,300, rejected near $81,000 |
Ethereum | $2,318.68 | -0.96% |
XRP | $1.28 | -1.45% |
Solana | $100.66 | -0.58% |
How Will the Fed Meeting Affect Bitcoin and Crypto?
CME FedWatch shows a 90.6% chance the Fed holds rates at 3.75% to 4.00%. A 25-basis-point hike has a 9.4% chance. Easing sits at 0%.
Timeframe | Hold (3.75%-4.00%) | Hike (4.00%-4.25%) |
Now | 90.6% | 9.4% |
1 day ago (Oct 23) | 90.0% | 10.0% |
1 week ago (Oct 16) | 84.5% | 15.5% |
1 month ago (Sep 25) | 35.8% | 64.2% |
A hold is now mostly priced in. Source: CME FedWatch.
So the words around the Fed Rate call may matter more than the call itself.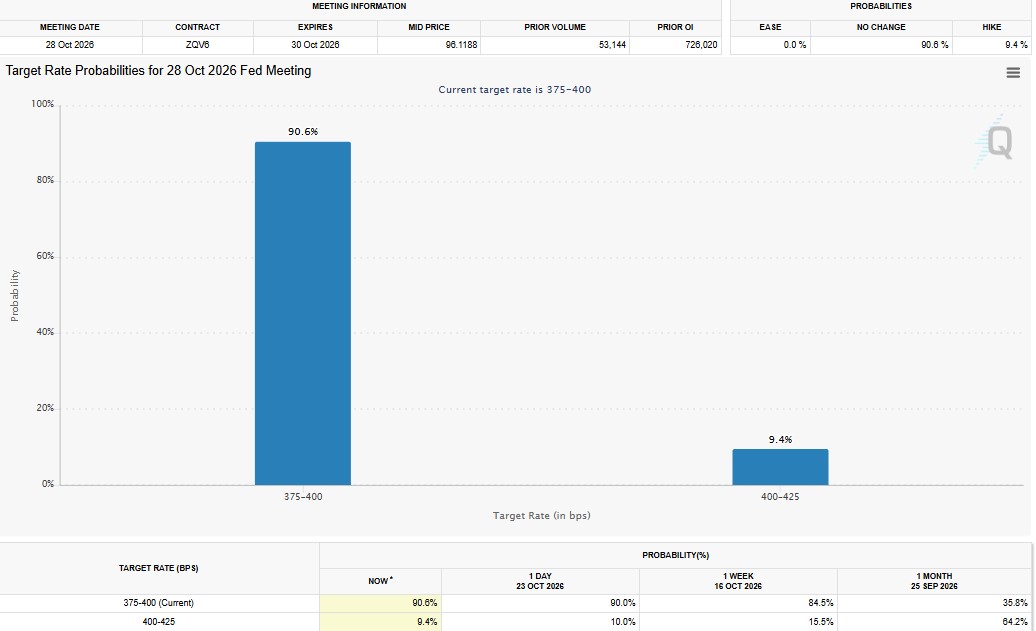
What Is Coming in Crypto This Week?
Date | Event |
Oct 28 | FOMC decision and Kevin Warsh press conference |
Oct 29 | US PCE inflation and GDP data |
Oct 30 | Japan unemployment data and BOJ rate decision |
All week | 35% of S&P 500 companies report earnings |
What Are the Bitcoin Support and Resistance Levels?
BTC trades below the 20-day EMA at $81,846 and the 50-day EMA at $80,733. RSI is near 41, which shows weak momentum.
Level | Type | Note |
$84,000 to $87,404 | Resistance | Range top |
$82,500 | Resistance | Floor lost last Thursday |
$80,700 to $81,850 | Resistance | 50-day and 20-day EMA |
$79,000 to $78,000 | Support | Immediate zone |
$77,629 | Support | 100-day EMA |
$76,300 to $74,000 | Support | 200-day EMA, next target |
Where Could Bitcoin Go Next?
If $79,000 to $78,000 breaks, a slide toward $76,300 to $74,000 is possible. A move toward $76,000 would signal a real downtrend.
If buyers reclaim $80,700 to $81,850, the way to $84,000 to $87,400 opens.
Recent sessions have repeatedly targeted leveraged retail positions. Liquidity clusters sit near $81,500, $79,000, and $78,800. Sellers are in control, so a sweep lower may come first.
A firm tone on the Fed Rate path could add pressure. A calm one may help buyers. Nobody knows yet.
How Many Crypto Liquidations Happened Today?
CoinGlass says 61,207 traders were liquidated in 24 hours. Longs took 73.8% of the losses.
Period | Total | Long | Short |
1 hour | $11.19M | $8.95M | $2.23M |
4 hours | $21.97M | $13.42M | $8.55M |
12 hours | $114.80M | $95.51M | $19.30M |
24 hours | $160.78M | $118.71M | $42.07M |
Coin | 24h Liquidations | Side |
Ethereum | $43.39M | 72.5% long |
Bitcoin | $36.11M | 75.5% long |
Others | $17.08M | 82.1% long |
XYZ:EWZ | $12.16M | 99.6% long |
Solana | $5.34M | Mostly long |
Zcash | $5.03M | Mostly short |
APR | $3.66M | Mostly long |
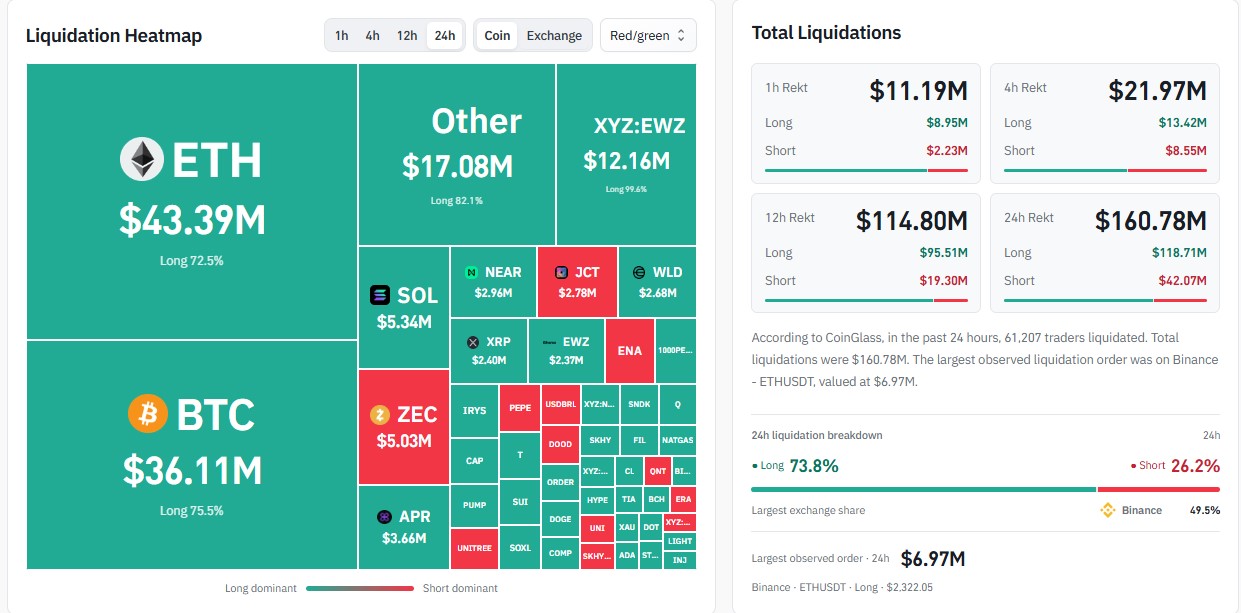
Source: CoinGlass. Binance had 49.5% of the total. The largest order was a $6.97 million ETHUSDT long at $2,322.05.
What Is the Crypto Fear and Greed Index Today?
Time | Score | Mood |
Now | 50 | Neutral |
Yesterday | 54 | Neutral |
Last week | 59 | Greed |
Last month | 74 | Greed |
Sentiment cooled from strong greed to neutral in a month. Source: alternative.me, updated Oct 26, 2026.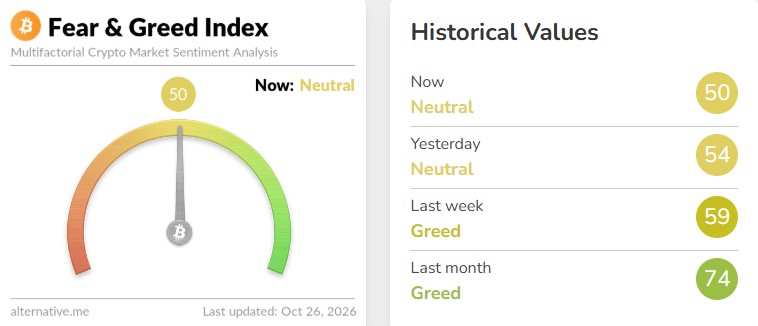
What Are the Ethereum Support and Resistance Levels Today?
ETH was rejected near $2,700 to $2,780 and has made lower highs. It slipped under the rising trendline from the July low.
Price sits below the 20-day EMA at $2,441 and the 50-day EMA at $2,459. It is near the 100-day EMA at $2,363 and the 200-day EMA at $2,318.90. RSI is 33.79, close to oversold.
Level | Zone | Why It Matters |
Resistance 2 | $2,500 to $2,550 | Relief rally target |
Resistance 1 | $2,360 to $2,460 | EMA zone bulls must reclaim |
Support 1 | $2,300 to $2,280 | Immediate floor |
Support 2 | $2,220 | Next stop if support breaks |
Support 3 | $2,150 | Deeper downside |
Will Ethereum Rebound or Drop Further?
If buyers defend $2,300 to $2,280 and reclaim $2,360 to $2,460, a rally toward $2,500 to $2,550 could follow.
If ETH breaks below $2,280 and stays there, $2,220 and $2,150 come into view.
What Are the XRP Support and Resistance Levels?
XRP trades near $1.28. Ali Charts says $1.26 is the lower edge of a channel forming since August. The 4-hour chart marks it with an arrow.
Level | Type |
$1.62, $1.52, $1.43, $1.34 | Resistance |
$1.26 | Support (channel line) |
$1.11 | Support (first target) |
$0.98 | Support (channel target) |
Can XRP Fall to $0.98?
The bearish case rests on fewer large wallets, higher exchange balances, and a break below $1.26.
If $1.26 fails, $1.11 comes first, about 12% lower. The channel then points to $0.98, about 22% below $1.26.
If $1.26 holds, XRP could stay between $1.26 and $1.34 for a while. None of this is certain.
Disclaimer
This article is for information only and is not financial advice. Crypto is volatile, and losses are possible. Do your own research before investing.

















