Shiba Inu Price Prediction: SHIB Just Lost 2,500 Holders! What’s Next?


Did SHIB lose 2,500 holders? Watch the Shiba Inu Price Prediction, and a post says the number of non-empty SHIB wallets on Ethereum dipped by 2,470 between October 27 and 28, citing Etherscan data.
It says the count has grown since and now stands at 1,696,148. The chart is the bigger issue: SHIB trades at $0.000004763, under both EMAs and under a broken rising channel.
Market data checked on October 31, 2026, at 12:08 IST.
Why is Shiba Inu price up today?
The Shiba Inu price today is up 1.13% to $0.000004763 in 24 hours, moving independently as Bitcoin fell 1.59%. The modest rise appears primarily driven by a technical bounce after a leveraged flush reduced immediate selling pressure, with no clear coin-specific catalyst visible in the provided data.
Primary reason: Relief bounce post-liquidation, as a $20 million leveraged position flush eased forced selling.
Secondary reasons: Decoupling from Bitcoin's decline and neutral social sentiment providing a stable backdrop.
Shiba Inu News: 2,470 Wallets Drop Off, Then Grow
A crypto account on X posted that, per Etherscan, the number of non-empty $SHIB wallet addresses on Ethereum fell by 2,470 between October 27 and 28.
The post says the cause is not clear and that the count has grown since. At 1,696,148, it calls the 1.7 million mark inevitable. That is 3,852 more wallets.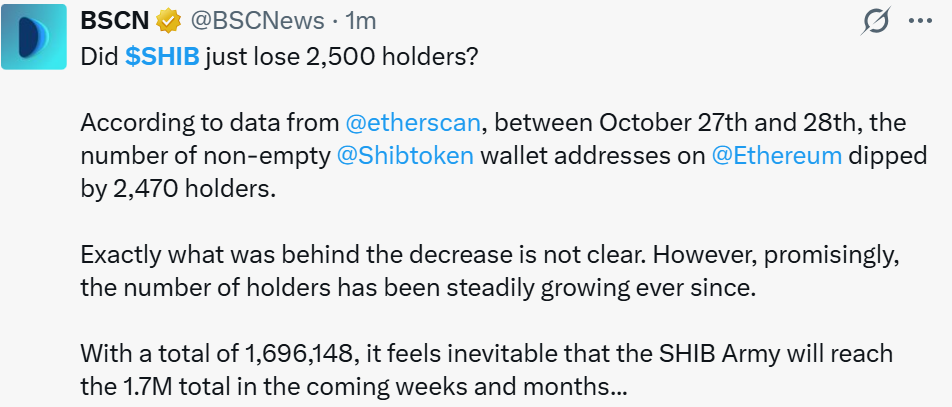
Source: Data From X
A wallet address is not a person, because one holder can own many. A non-empty wallet is one that holds a balance. The "inevitable" call is the post's opinion. CoinGabbar could not verify the figures.
Crypto News Today: SHIB Liquidation Data
A liquidation happens when an exchange force-closes a leveraged trade because the trader can no longer cover losses. Longs bet on a rise, and shorts bet on a fall.
Window | Total Liquidated | Long | Short |
12h | $10.60K | $1.12K | $9.48K |
24h | $46.14K | $5.03K | $41.10K |
Source: Data From CoinGlass
Shorts took about 89% of the $46.14K liquidated over 24 hours, which fits yesterday's bounce. The amounts are small.
$SHIB Prediction: Technical Analysis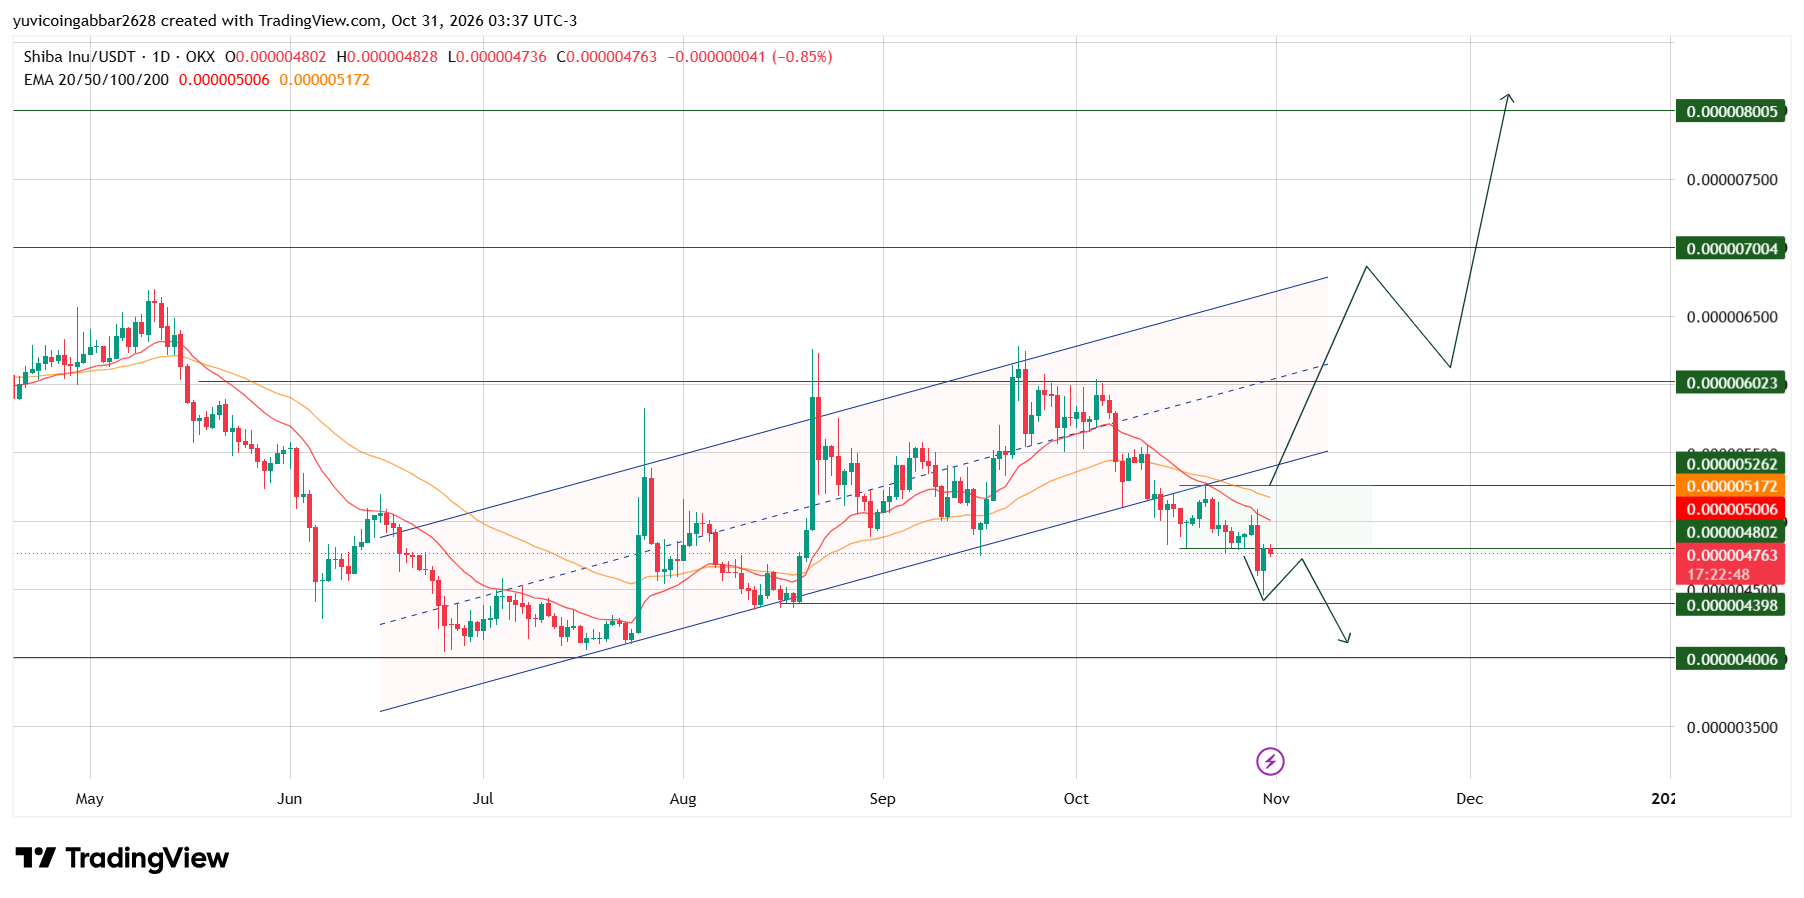
SHIB fell from May highs to a low near $0.0000041 in June. It then climbed inside a rising channel, a pair of upward-sloping boundaries that hold price in a range, and reached about $0.0000062 in September.
In October, the price fell through the channel's lower boundary. A rebound toward it failed, and $SHIB has traded under it since.
Yesterday's candle dipped to near $0.0000044, just above the $0.000004398 support, then closed near today's open of $0.000004802. Today's candle reached $0.000004828 and fell back to $0.000004763. It was still open, so the close can change.
An EMA, or exponential moving average, weights recent prices more heavily. Price is about 5.1% under the 20 EMA $0.000005006 and 8.6% under the 50 EMA $0.000005172. The 20 EMA sits below the 50 EMA, a bearish order.
Shiba Inu Forecast: Support and Resistance Levels
Type | Level |
Highest marked level | $0.000008005 |
Resistance 4 | $0.000007004 |
Resistance 3 | $0.000006023 |
Resistance 2 | $0.000005262 |
Resistance 1 | $0.000004802 |
Immediate support | $0.000004398 |
Deeper support | $0.000004006 |
Bull case: A daily close above $0.000004802, then the 20 EMA at $0.000005006, about 5% higher, would put the 50 EMA at $0.000005172 and $0.000005262 in view.
Bear case: If $SHIB closes below $0.000004398, about 8% lower, the price could slide about 16% toward $0.000004006.
SHIB Scenarios and Invalidation (October 31, 2026)
Scenario | Trigger | Likely Outcome | Invalidation |
Bull | Close above $0.000005262 | Move toward $0.000006023 | Close below $0.000005006 |
Base | Range of $0.000004398 to $0.000004802 | Sideways under the EMAs | Break of either level |
Bear | Close below $0.000004398 | Slide toward $0.000004006 | Close back above $0.000004398 |
Shiba Inu Price Prediction: Can Shiba Inu Reach $0.000006023?
It would take a gain of about 26% from $0.000004763. Any SHIB Forecast toward that level needs more than a holder count.
Shiba Inu Price Prediction: CoinGabbar Technical View 2026
The level to watch is $0.000004398. A daily close below it would open $0.000004006, while a close above $0.000005262 would be the first real sign of strength.
Disclaimer
This article is for informational purposes only and isn't financial advice. Crypto markets are volatile. Always do your own research before making any trading decisions involving SHIB.