Why Is HBAR Up 22% Today? Eyes $0.15: Hedera Price Prediction

Hedera price prediction is the search everyone is running after. HBAR grabbed the market's attention in a big way.
The move has traders split between chasing and waiting, and the chart has a clear answer for both camps. Here is the hourly chart read, using market data available on Sep 29, 2026.
Our editorial desk holds no personal position in HBAR. This is purely a chart and data read.
Hedera Price Today
HBAR is priced near $0.11937 on the TradingView chart, and the CoinGlass card shows $0.11941, up 22.6% over 24 hours. Market cap sits at $5.21B.
The chart is the Binance perpetual contract (a futures contract with no expiry date), so it can differ slightly from spot prices.
Open interest (the total value of unsettled futures contracts) stands at $279.19M.
Futures volume over 24 hours is $2.62B against $662.24M in spot volume, so derivatives trading is about four times spot activity. Circulating supply is 43.83B out of a 50.00B maximum.
Source: CoinGlass, Sep 29, 2026.
Hedera News Today
A post on X by ALLINCRYPTO (@RealAllinCrypto), shared about 10 hours before this update, says HBAR jumped roughly 25% on the day and is trading around $0.12 after a very large candle. 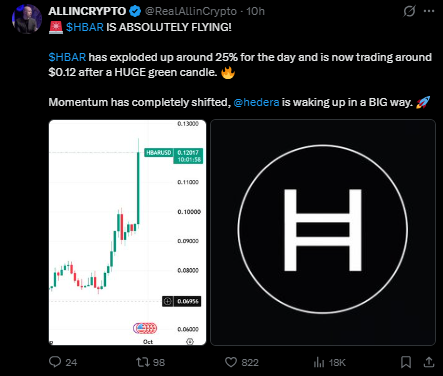
The post argues momentum has shifted in Hedera's favor. CoinGlass shows a slightly smaller 22.6% gain because the two figures were captured at different times.
This is a momentum post, not a network development. It confirms how strong the move was, but it does not point to a new catalyst behind it. Anyone following the Hedera latest news should keep that distinction in mind.
Source: ALLINCRYPTO on X, Sep 29, 2026.
Quick Take
CMP: $0.11937
Bullish trigger: hourly close above $0.13100
Bearish trigger: hourly close below $0.10988
Data time: Sep 29, 2026, 11:29 UTC+5:30
Risk note: this is a 1-hour setup after a vertical rally, so moves can reverse quickly.
Hedera Price Prediction 2026 Technical Analysis
Methodology: 1H timeframe, Binance perpetual contract, a descending channel, marked support and resistance levels, and the chart oscillator label. The bearish trigger is an hourly close below $0.10988.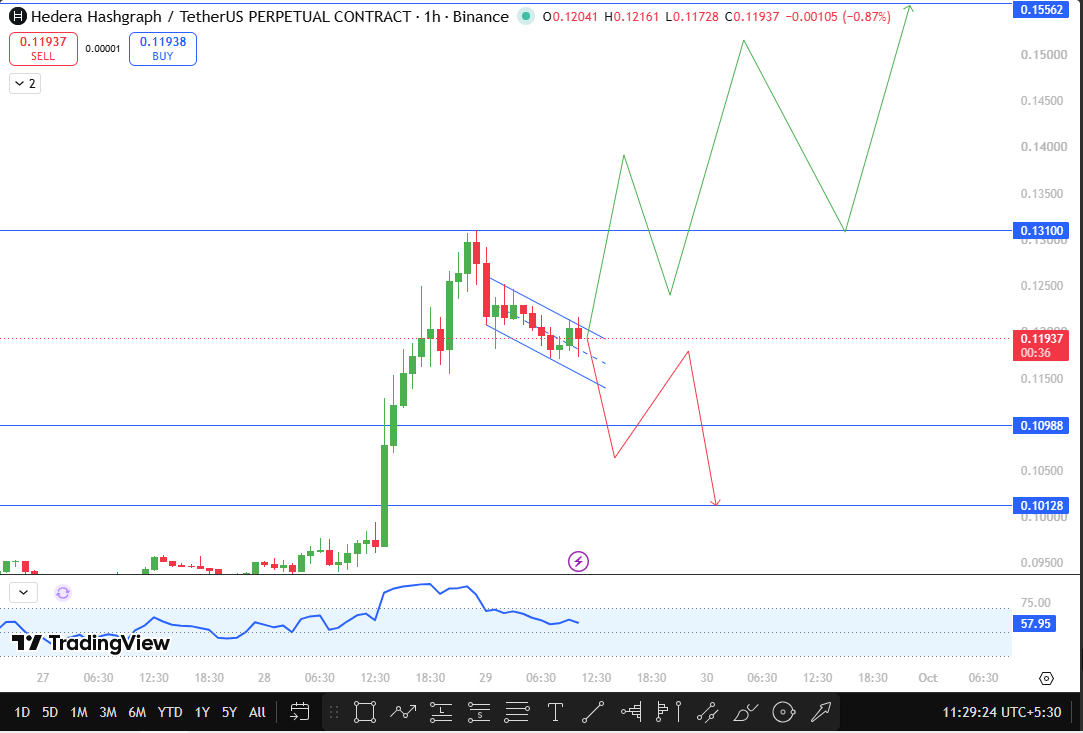
HBAR climbed almost in a straight line from around $0.097 to a high near $0.131, then stalled at the $0.13100 mark. Since that peak, the price has been sliding lower inside a descending channel.
The candles are small and orderly, which looks more like a cooling-off phase than a panic exit. The oscillator has eased to 57.95 from its rally-time peak, which matches that read.
A hard break out of the channel is what decides the next HBAR price prediction.
The projected paths on the chart show two routes. In one, HBAR breaks up through the channel, pushes toward $0.13100, retests it, and then heads for $0.15562. In the other, the channel fails, the price drops under $0.10988, bounces briefly, and slides on to $0.10128.
The bullish route needs an hourly close above $0.13100, not just a wick through it. Until then, this remains a pullback inside a rally, not a confirmed continuation.
Source: TradingView, 1H Binance perpetual, Sep 29, 2026, 11:29 UTC+5:30.
Hedera Support and Resistance
Level | Type | Distance from CMP |
$0.15562 | Next resistance | +30.4% |
$0.13100 | Breakout trigger | +9.7% |
$0.11937 | CMP | 0% |
$0.10988 | Key support | -8.0% |
$0.10128 | Next support | -15.2% |
Bull, Base, and Bear Scenarios
Bull case. HBAR breaks out of the channel and closes an hour above $0.13100. That clears the recent peak and opens the road to $0.15562, roughly 30% above today's price. A retest of $0.13100 as support along the way would be a healthy sign.
Base case. HBAR keeps drifting lower inside the descending channel while the rally digests. Sideways or slowly falling action after a jump this big is normal and does not damage the bigger picture.
Bear case. The channel gives way, and the price closes an hour below $0.10988. Sellers then have room to push toward $0.10128, about 15% below today's price.
Risks
Derivative volume is far larger than spot volume, so a leverage flush can move HBAR fast in either direction.
The rally came without a clear fundamental trigger in the news supplied, which makes it easier to fade.
This is an hourly chart, so signals can flip within a day. Broader market swings can override any technical setup.
Disclaimer
This article is for information and education only and is not financial advice. Crypto assets are volatile, and you can lose money. Do your own research before making any decision.



.webp)













