Hyperliquid Price Prediction: Can HYPE Break the $86.61 Wall?


Something's about to give. The squeeze on this chart keeps tightening. Will buyers finally push through, or will sellers flip the script again?
This Hyperliquid price prediction maps the triangle, ETF flows, and key levels as of October 11, 2026, 3:40 PM IST (10:10 UTC). More crypto price predictions cover other coins.
Hyperliquid Price Today: HYPE Market Snapshot
Current Price and 24H Performance
Metric | Value |
Price | $84.95 |
24H change | +0.69% |
7D change | -4.88% |
30D change | +8.34% |
All-time high | $97.98 (Sep 23, 2026) |
Source: CoinMarketCap, CoinGlass, 10:10 UTC.
Hyperliquid price today reads $84.95, up 0.69% over 24 hours, per CoinMarketCap spot data. Barely a flicker. But the weekly view stings. HYPE is down 4.88% over seven days and sits 13.29% below its peak.
Trading Volume and Market Cap
Spot volume reached $549.65M, about 2.54% of the $21.59B market cap. Futures dominate. CoinGlass derivatives data shows $1.19B in futures volume against $81.53M in spot. Open interest, the total value of open futures contracts, sits at $3.24B.
Why Is HYPE Moving Today?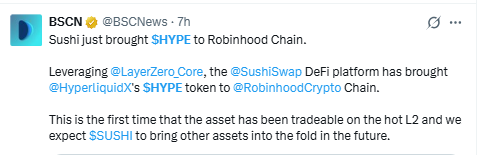
Breaking: Sushi reportedly brought HYPE to Robinhood Chain. A BSCN News post says LayerZero powers the bridge, the first time HYPE trades on that layer-2, a faster network built on a main blockchain.
Price reaction? Mild. Up 0.69%. An access story, not a demand shock. Social posts deserve caution.
HYPE Technical Analysis: Triangle Squeeze on the 1H Chart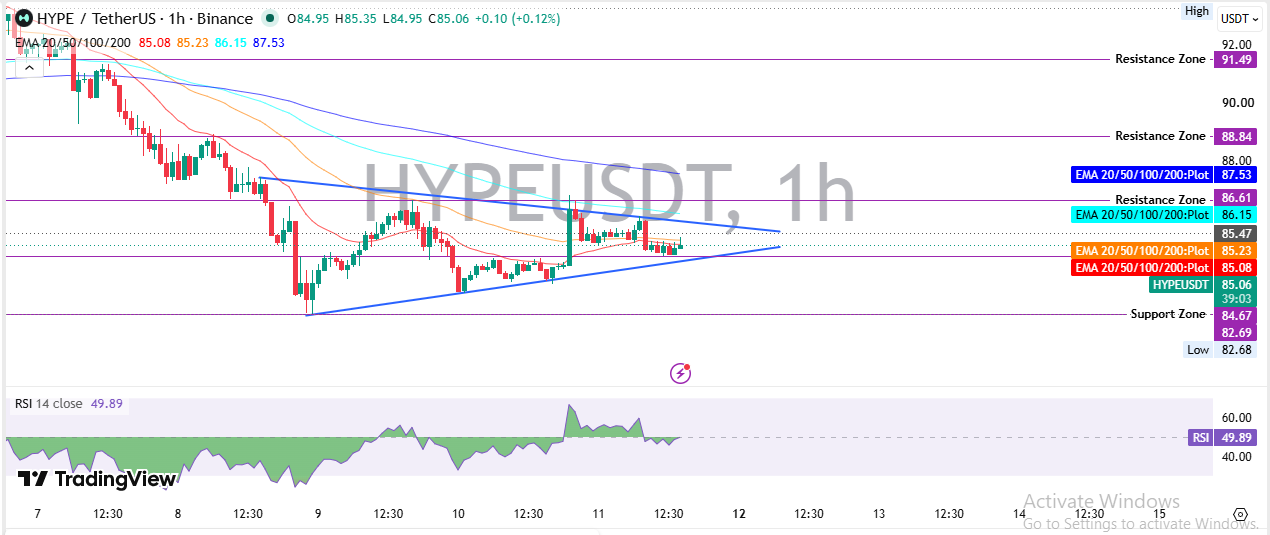
HYPE technical analysis studies past trading to judge likely next moves. Price is coiling inside a symmetrical triangle, where a falling top line and a rising bottom line squeeze the range.
The lines meet around October 12. Chart used: 1-hour Binance HYPEUSDT, October 11, 2026, 3:40 PM IST (10:10 UTC).
The 20 EMA, 50 EMA, 100 EMA, and 200 EMAs sit at $85.08, $85.23, $86.15, and $87.53 on the TradingView HYPEUSDT chart. Price at $85.06 trades under all of them. Sitting beneath every average. And that's the first warning.
RSI reads 49.89, dead center. ADX, a trend-strength gauge, reads 14.30, and anything under 20 usually means nobody's in control.
Hyperliquid Support and Resistance Levels
These Hyperliquid support and resistance levels come from zones marked on the chart.
Key Support Levels
Support is where buyers stepped in before. First sits $84.67, only 0.46% below price, then $82.69 and the $82.68 low. An earlier head and shoulders breakdown pointed toward $81.251.
Key Resistance Levels
Resistance is where sellers pushed back before. The first wall is $86.61, 1.82% above price beside the 100 EMA, then $88.84 and $91.49. Older zones appear in the October Hyperliquid forecast.
HYPE ETF Flows: Is Institutional Demand Cooling?
A HYPE ETF is a stock-exchange fund holding the token. Three US spot funds trade: HYPG (Grayscale), BHYP (Bitwise), and THYP (21Shares).
They hold $451.84M in net assets, with $336.36M in cumulative inflows.
But momentum cooled. October 8 brought a $9.70M outflow, and October 9 stayed flat, per the SoSoValue ETF tracker. Demand isn't collapsing. It isn't rescuing the chart either.
Derivatives Positioning: Long/Short Ratio and Liquidations
The long/short ratio compares accounts betting up against accounts betting down. Binance reads 1.5336 and OKX reads 2.21.
Because longs outnumber shorts. Any dip can snowball into a flush. Liquidations, forced exits from margin-starved trades, hit $593.68K in 24 hours, with longs taking $407.40K.
So who blinks first, the crowded longs or the patient sellers? Headlines flip this crowd fast, so the latest crypto news deserves a check.
Can HYPE Rally Continue? Bull, Base, and Bear Cases
Bullish Scenario
Bulls need hourly candles trading above $86.61 on rising volume, clearing the triangle top. That makes $88.84 the first $HYPE price target and $91.49 the next.
Invalidation: a slide under $84.67. Anyone asking can $HYPE reach $100 can start with the $100 breakout scenario, since $100 sits 17.56% above price.
Base Scenario
Price rotates between $84.67 and $86.61 while ADX stays under 20. But compression doesn't last forever. Bitcoin usually sets the tone for altcoins, so a Bitcoin price prediction can sway timing.
Bearish Scenario
Bears need hourly candles trading below $84.67, opening $82.69 and the $82.68 low. Invalidation: a reclaim of $85.23, the 50 EMA.
The stance: bearish tilt, since price trades under every EMA and ETF flows turned negative. Actually, cautious bearish fits better, because the 90-day gain of 26.30% says buyers still own the bigger trend. Past whale selling update coverage deserves a read beside this setup.
What Could Change the Forecast?
A strong ETF inflow or rising Robinhood Chain volume could flip the base case. The earlier whale wallet buy report showed whale news acts as a sentiment signal, not a trend driver.
Hyperliquid Price Prediction for October 2026
This Hyperliquid price prediction for the month rests on marked levels.
Bull Case
Trading above $88.84 could lead to $91.49, with the $97.98 peak back in view if ETF inflows return. Longer-term bulls often lean on the onchain revenue argument.
Base Case
A choppy $82.69 to $88.84 range fits ADX at 14.30 and RSI at 49.89.
Bear Case
A slide below $82.68 would leave no marked support, so downside targets would need fresh levels.
Risks That Could Change the $HYPE Price Prediction
Triangle breakouts can fail within hours. And single-source news carries risk, as the Lion Group HYPE purchase story rested on one X post.
Final Takeaway
Hyperliquid price prediction boils down to one level: $86.61. Trading above it opens $88.84 and $91.49, while trading below $84.67 opens $82.69. If buyers push through $86.61. Then $88.84 becomes the next test.
The setup leans cautious and bearish until that happens. But a triangle this tight rarely stays quiet. Timing matters here.
Disclaimer: This article is informational only and isn't financial advice. Crypto is highly volatile, and capital can be lost. Independent research is essential before any trade.

















