Injective Price Prediction: Can INJ Reclaim $8.63 After Breakout?

Can INJ reclaim the $8.630 level, or does it slide back toward the $7.659 support level?
This Injective price prediction starts with the breakout above a key trendline on Nov 11, 2026. Buyers now need $8.125 to hold, and the wider November forecast leans on that level too.
INJ Price 24-Hour Data Snapshot
The CoinGecko market data captured on Nov 11, 2026, at 06:40 UTC shows $INJ at $8.162, up 0.5% over 24h.
Metric | Value |
Price | $8.162 |
24h range | $7.68 to $8.43 |
Market cap | $816.78M |
FDV | $816.78M |
24h volume | $104.93M |
Perps open interest | $226.80M |
Source: CoinGecko, $INJ market snapshot, Nov 11, 2026, 06:40 UTC
Supply sits at 100M, so FDV equals market cap. And 24h trading volume of $104.93M equals 12.8% of market cap.
INJ Price Performance Inside the 24h Range
The $8.162 price sits 6.4% above the 24h low of $7.68. It's also 3.1% below the $8.43 high, so buyers hold most of the range but not the top.
The 0.5% gain in USD terms reads as flat. On second thought, $INJ rose 1.5% against BTC and 3.1% against ETH. Traders can check the latest crypto market news for BTC and ETH direction, since that relative strength shapes this Injective price prediction.
INJ Holder Concentration Data
Arkham's holder list shows the Injective Bridge wallet holding 89.02% of supply, about $775.91M, at 06:40 UTC on Nov 11, 2026. It's a bridge that keeps tokens locked, so it isn't one big holder waiting to sell.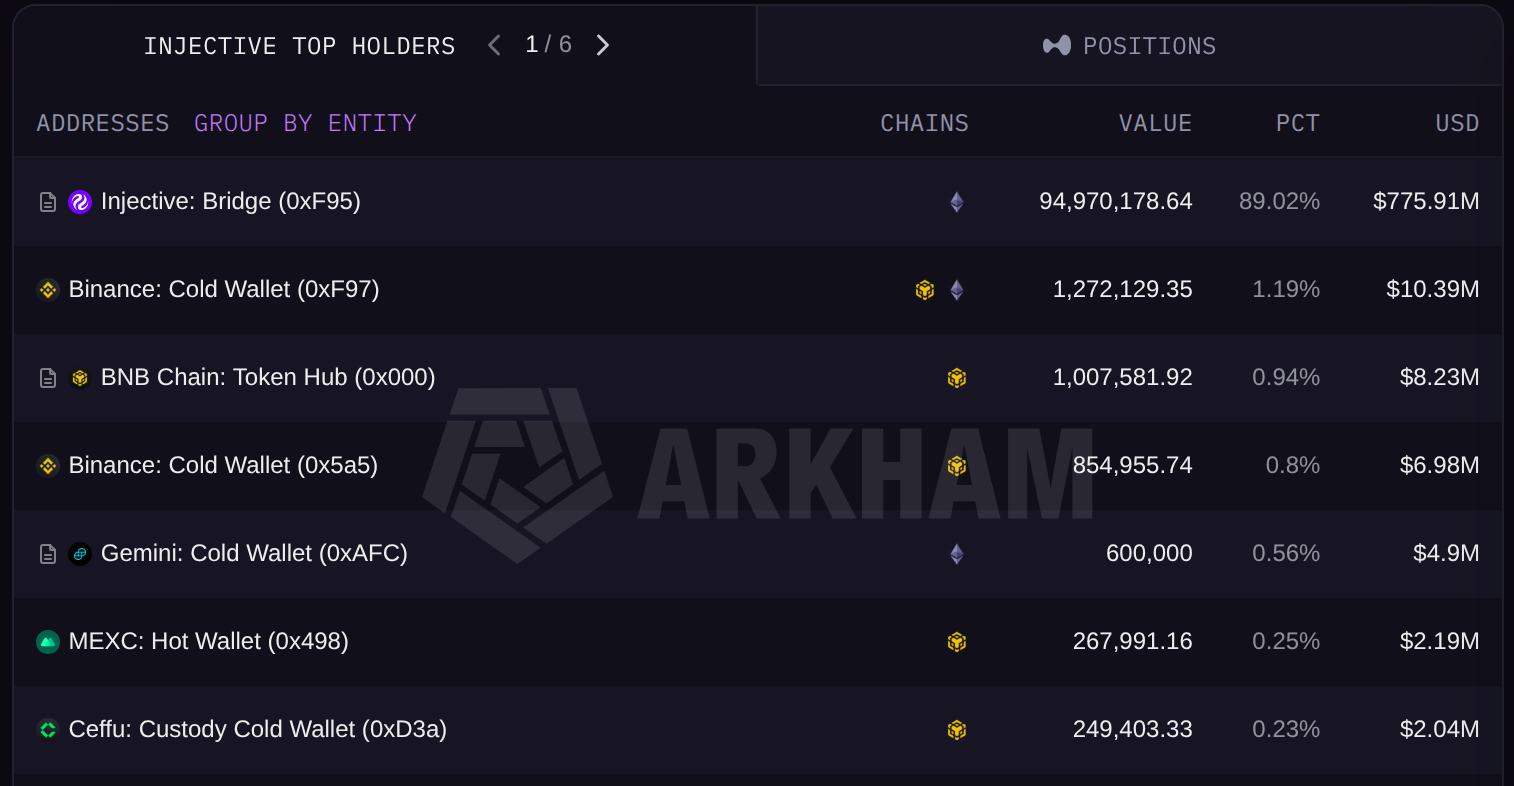
Source: Arkham, Injective top holders, Nov 11, 2026, 06:40 UTC
Two Binance cold wallets follow at 1.19% and 0.80%. The five exchange and custody wallets listed hold 3.03%, or $26.50M, so these wallets point to exchange infrastructure, not private holders.
INJ Liquidation Data Over a 24-Hour Timeframe
The $INJ liquidation data shows longs getting hit in the last hour. A liquidation is a forced exit when a trader can't cover losses. CoinGlass counts $40.95K of longs forced out and $0.00 of shorts over 1h, as of Nov 11, 2026, 06:40 UTC.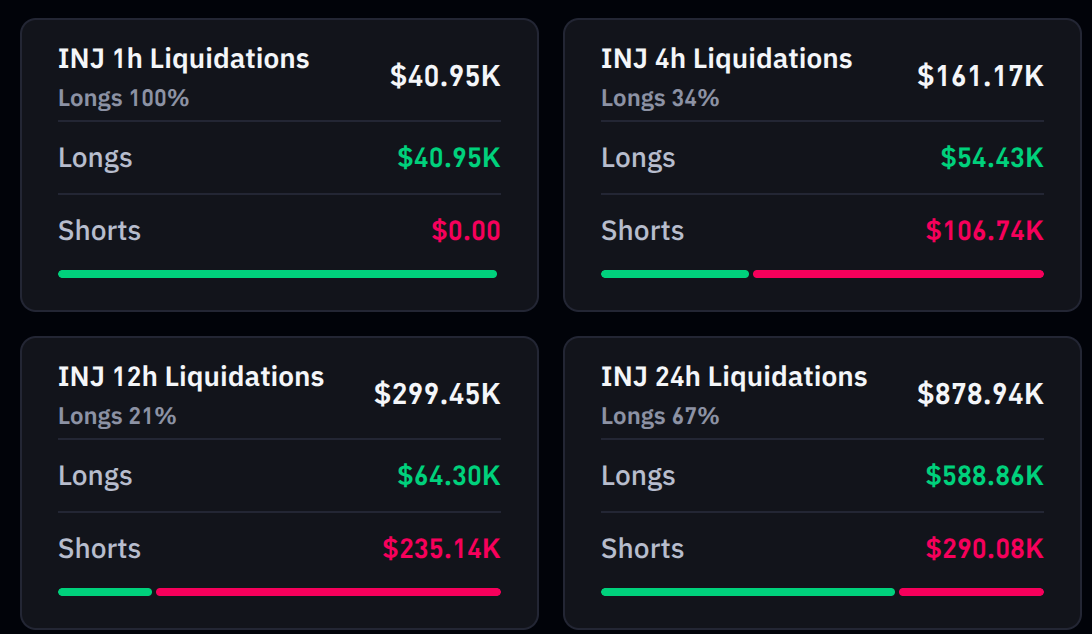
Source: CoinGlass, $INJ liquidations, November 11, 2026, 06:40 UTC
Over the last 12 h, shorts lost $235.14K, while longs lost only $64.30K. across the full 24h, $878.94K was liquidated, and longs made up $588.86K of that. In the last hour, the pain shifted back to long.
Injective Open Interest Data by Exchanges
Open interest, the total value of futures contracts still open, totals $146.93M in the CoinGlass futures data as of Nov 11, 2026, 06:40 UTC. INJ open interest stands at $30.90M on Binance and $24.68M on Gate.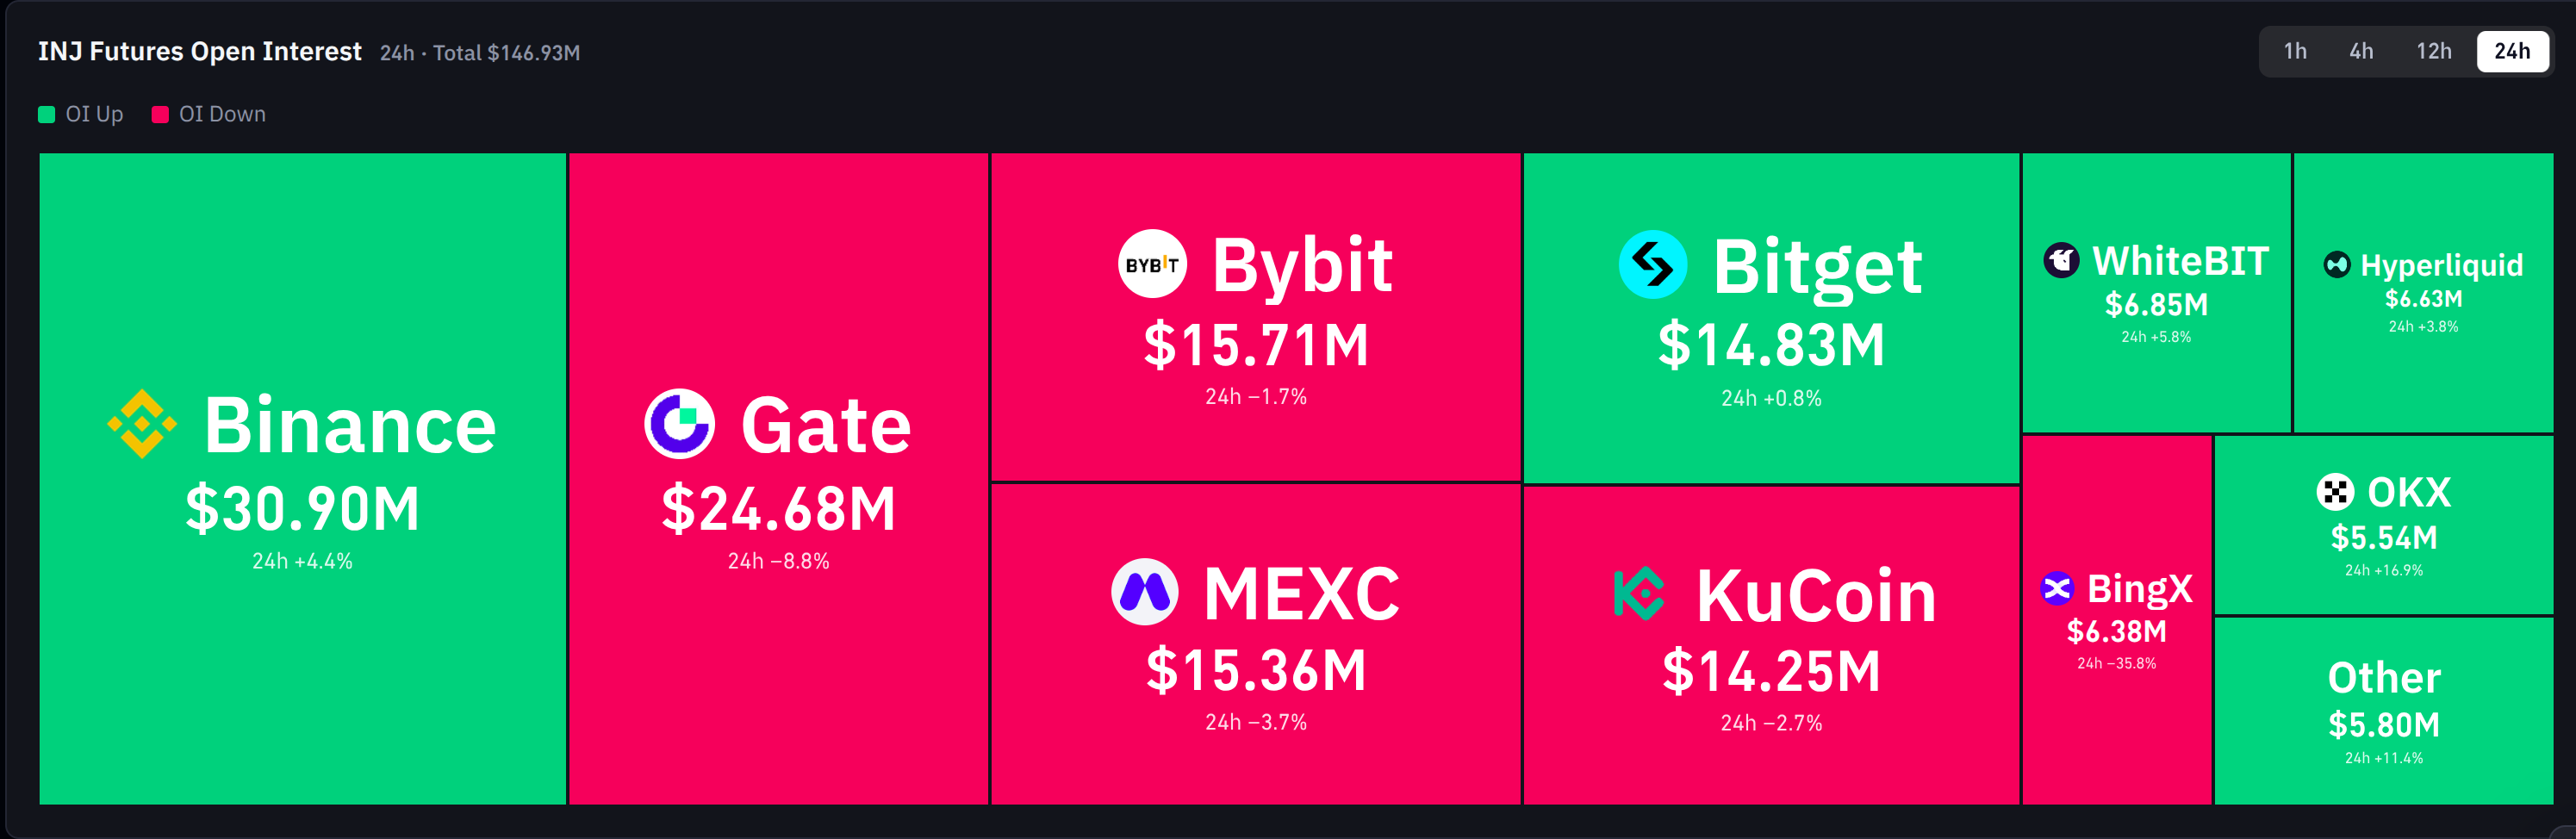
Source: CoinGlass, $INJ futures open interest, 24h, November 11, 2026, 06:40 UTC
The gap between Binance and Gate is $6.22M, and the earlier INJ ETF rally is a useful reference for today's positioning. But direction splits, since Binance rose 4.4% over 24 hours while Gate fell 8.8%.
Injective Technical Analysis: 50 EMA and RSI Levels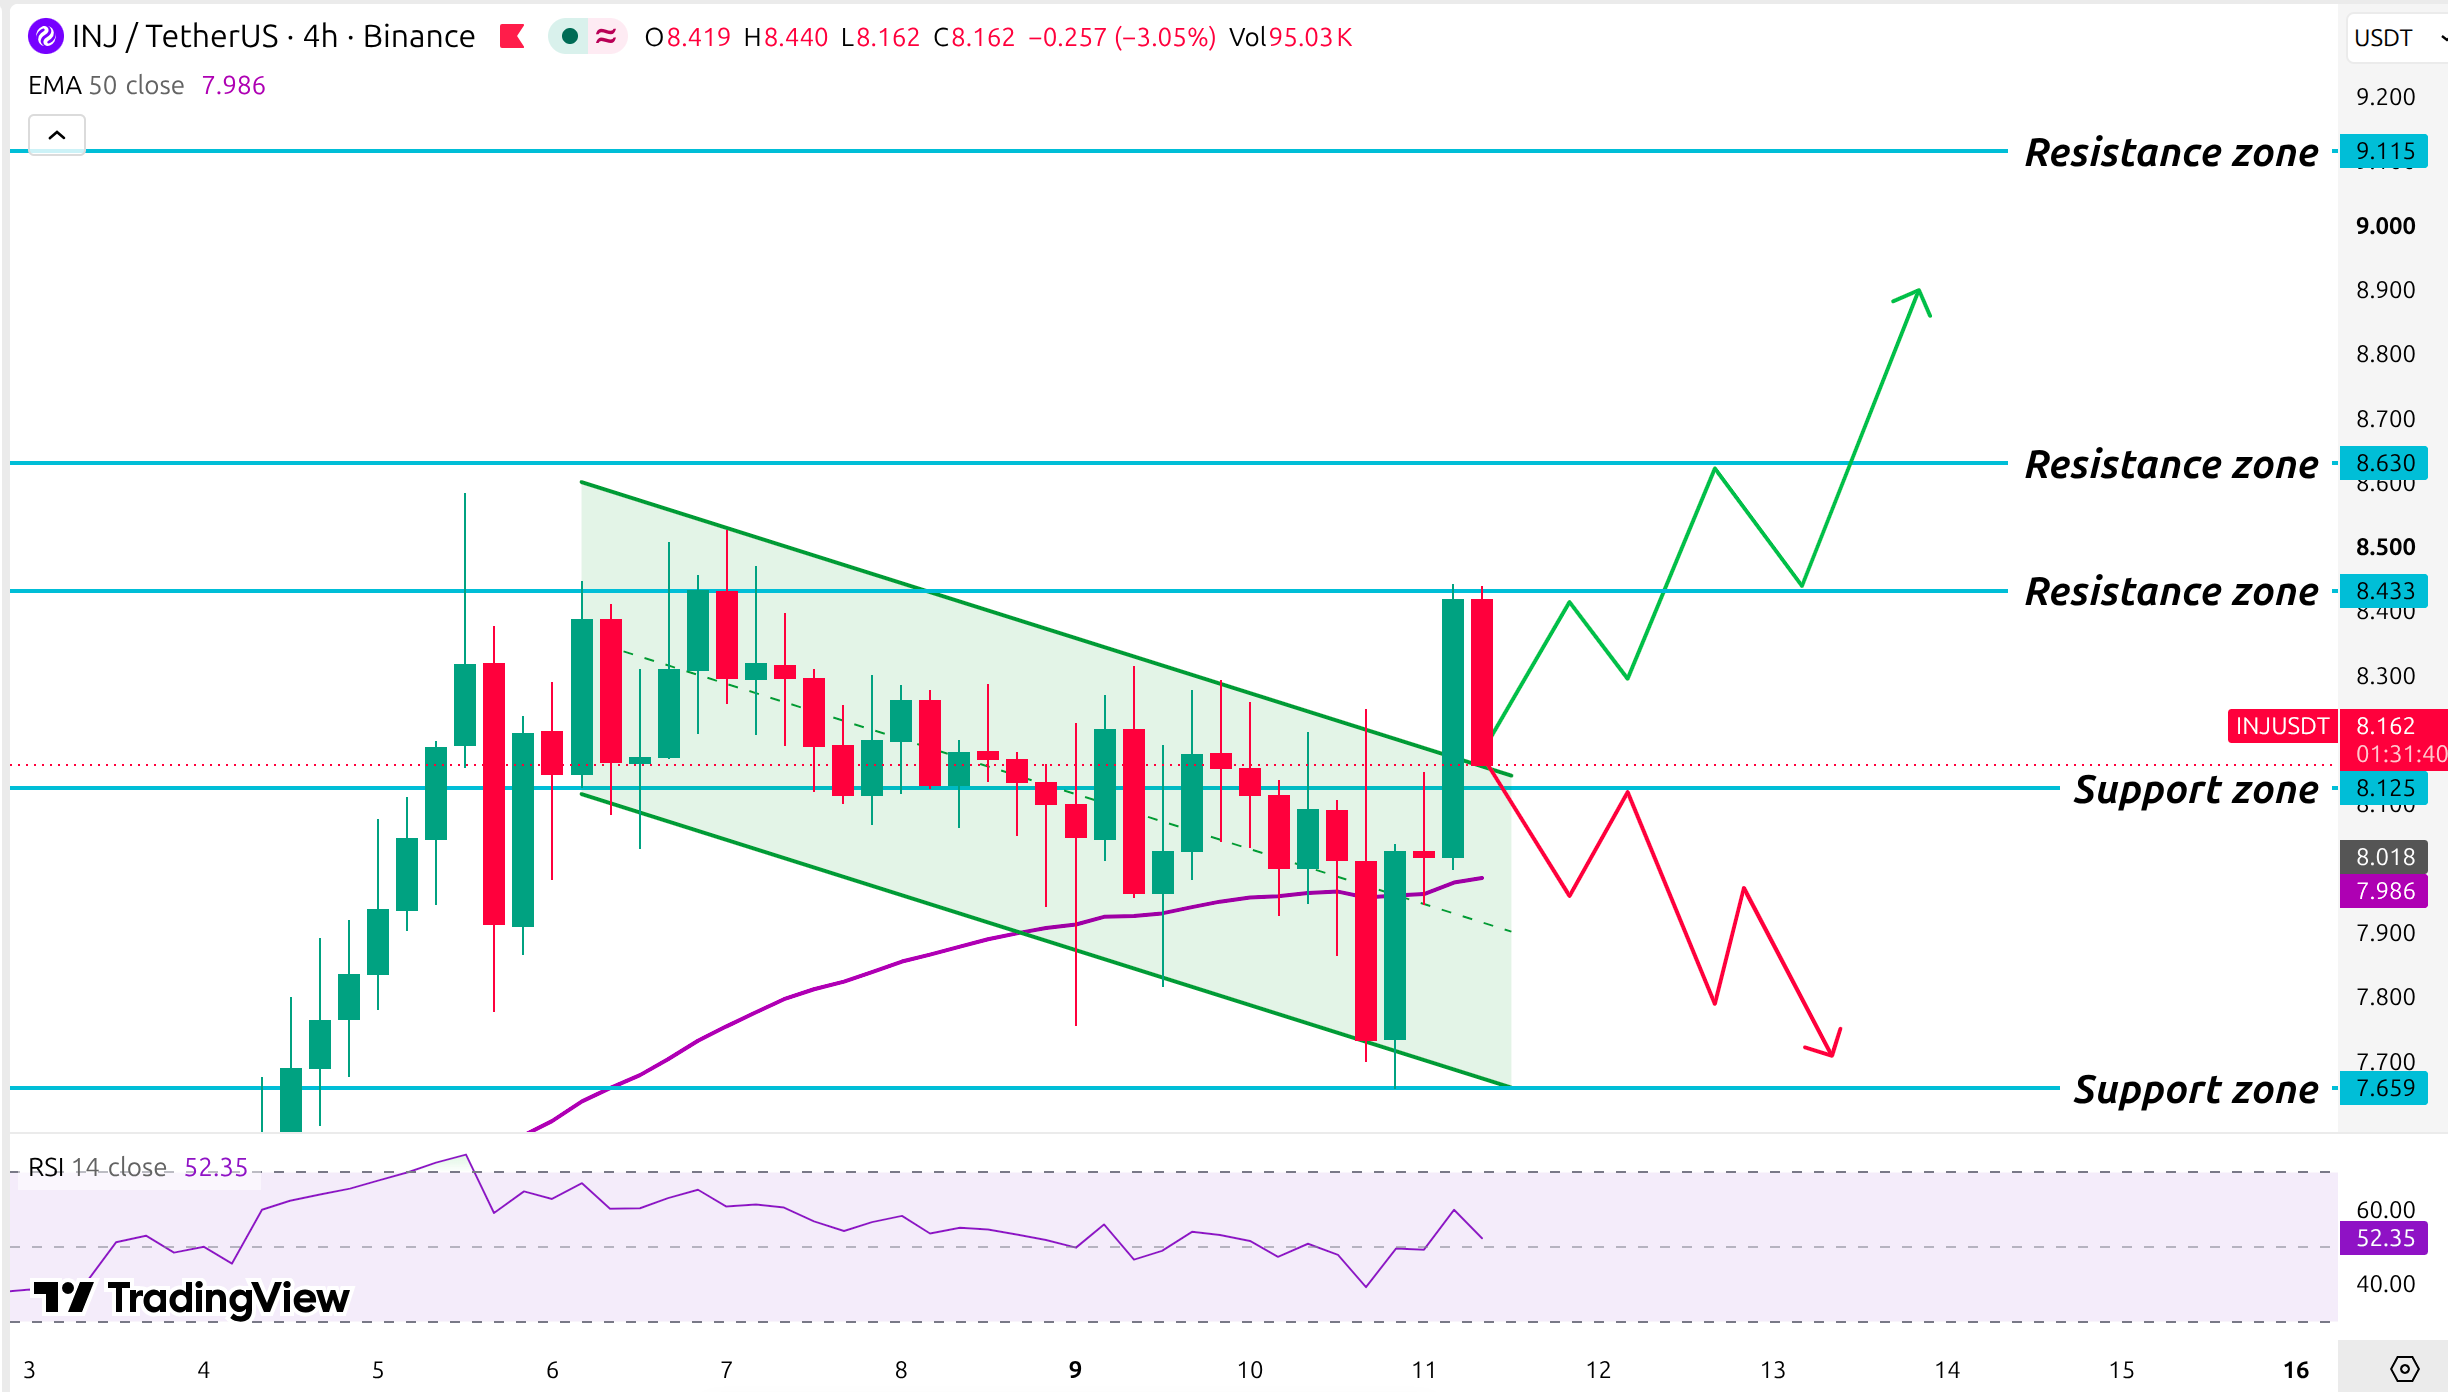
Source: TradingView. INJUSDT 4-hour, EMA 50, and RSI 14, November 11, 2026, 06:40 UTC.
The Binance 4-hour chart for INJ/USDT on TradingView, captured Nov 11, 2026, 06:40 UTC, frames this Injective price prediction. A sharp climb into Nov 5 stalled just under the $8.630 resistance zone before sellers took control.
Price then slid inside a falling channel, two parallel downward lines that hold price between resistance and support. The market tried many times to break the upper trendline, but sellers defended it.
Buyers stepped in at the $7.659 support zone on Nov 10, and a 4-hour candle broke the upper trendline of the channel. It ran into the $8.433 resistance zone, where sellers cap rallies. See the INJ levels analysis. Sellers rejected the next candle there.
Right now, the $8.162 price trades just above the $8.125 support and the old trendline. The INJ 50 EMA, a moving average that weights recent candles most, sits at $7.986, and price trades 2.3% above it.
The latest 4-hour candle trades above the EMA too, so buyers must defend the 50 EMA level. The INJ RSI reads 52.35 on the 4-hour 14-period setting.
It touched about 75 in the Nov 5 rally. Above 50, buyers hold the momentum edge, and a reading under 30 means selling has gone too far.
Injective Support and Resistance Levels
Level | Role |
$9.115 | Resistance |
$8.630 | Resistance |
$8.433 | Resistance |
$8.125 | Support |
$7.986 | 4-hour 50 EMA |
$7.659 | Support |
The nearest $INJ support levels and $INJ resistance levels are $8.125 and $8.433.
Injective Price Prediction: Bull, Base and Bear Scenarios
Scenario | Trigger | Target | Invalidation |
Bull | 4-hour candle above $8.433 | $8.630, $9.115 | Below $8.125 |
Base | Between $8.125 and $8.433 | Range trade | Outside the range |
Bear | 4-hour candle below $8.125 | $7.986, $7.659 | Above $8.433 |
The $INJ price forecast stays range-bound until a 4-H candle trades outside that band. The Injective price prediction then follows whichever side gets volume.
A 4-hour candle below $8.125 would turn the breakout into a false breakout, a move that fails and reverses. A second risk is a derivatives unwind, where open interest falls as longs exit.
Injective Price Forecast: Expert Outlook
According to Coingabbar analysis, it leans cautiously bullish on the Injective price prediction while $8.125 holds. The channel breakout and an RSI of 52.35 favour buyers, though the $8.433 rejection caps conviction.
A 4-H candle trading below $8.125 would mean the breakout failed and sellers regained control.
Disclaimer: This article is for information only and isn't financial advice. Traders should do their own research and risk only what they can afford to lose.