Injective Price Prediction: Can INJ Break $9.115 on ETF News?


Is $9.115 the next stop for INJ after the ETF news?
Buyers took $INJ to $8.51 at 11:00 UTC after Injective said Nasdaq approved a staked ETF. That gives the Injective price prediction a fresh starting point, and now buyers have to defend it. For the earlier setup, see the prior INJ forecast.
Injective 24-Hour Price Forecast Snapshot
CoinGecko market data captured at 11:00 UTC on Nov 5, 2026, ranks Injective at 83rd. Fully diluted valuation (FDV) is the value if every token existed, and here it equals the market cap.
Metric | Value |
Price | $8.454 |
24h range | $7.60 to $8.56 |
Market cap | $853.148M |
FDV | $853.148M |
24h trading volume | $117.628M |
Source: CoinGecko, INJ market snapshot, Nov 5, 2026, 11:00 UTC
All 100M tokens already circulate, so no new supply waits to hit the market. Volume of $117.628M shows how easily traders can enter and exit.
INJ News: Nasdaq Approves Staked ETF
A staked ETF is a fund that holds a token and locks it in staking to earn rewards. Per the official Injective X post, Nasdaq has officially approved the listing of the first INJ staked ETF, ticker INJC.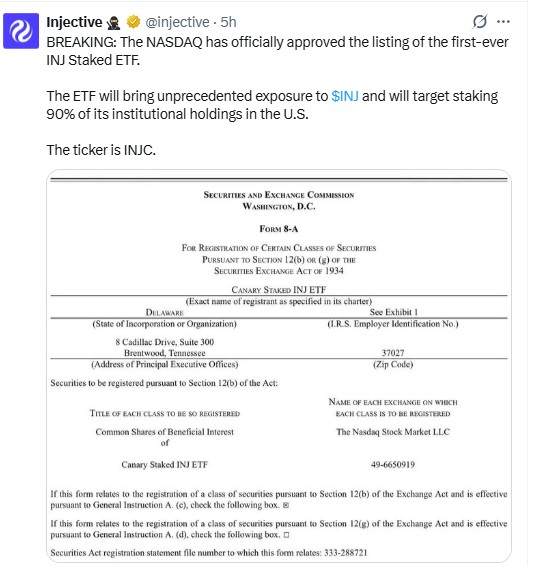
Source: Injective official X post, about five hours old at the Nov 5, 2026, 11:00 UTC capture
The post says the fund will target staking 90% of its institutional holdings in the U.S.
If trading starts, holding $INJ means buying it, and staking locks those tokens away from sellers. If the launch slips, the rally loses its main catalyst, and the price may slide toward $8.125 support. For future context, see the Bitnomial INJ futures update.
INJ Price Performance: Rally Nears 24h High
CoinGlass price performance data at 11:00 UTC shows $INJ up 10.07% in 24h and 10.14% in 30 days. The 90-day gain is 84.93%.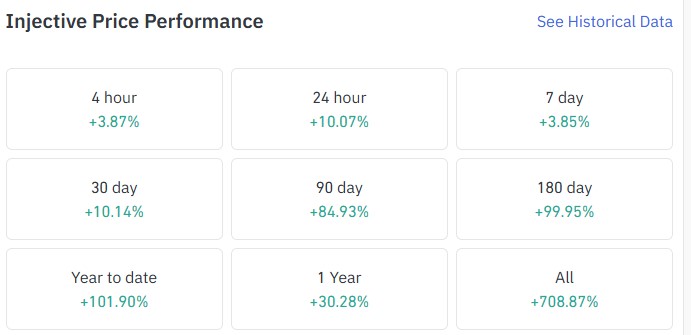
Source: CoinGlass, $INJ price performance, Nov 5, 2026, 11:00 UTC
The price of $8.454 trades 0.6% below the 24h high of $8.56 and 12.0% above the $7.60 low. Buyers sit near the range top, so late entries carry the most risk. For wider context, see the latest crypto market news.
Injective Liquidation Data: Shorts Burn
Shorts got hit hard. CoinGlass liquidation data, captured at 11:00 UTC, shows $615.09K liquidated in 24h. Shorts lost $530.07K of that. Longs lost $85.02K.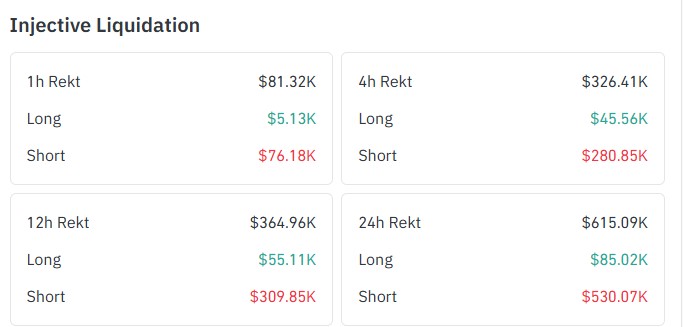
Source: CoinGlass, $INJ liquidation data, Nov 5, 2026, 11:00 UTC
In the last hour, shorts lost $76.18K against $5.13K for longs. Forced short covering means forced buying, and that can lift price until shorts run out.
INJ Open Interest: Binance Leads Futures
Open interest is the total value of futures contracts that traders are still holding. On CoinGlass, $INJ open interest was $141.31M at 05:30 UTC on Nov 5, 2026, still under the $205M peak from mid-October.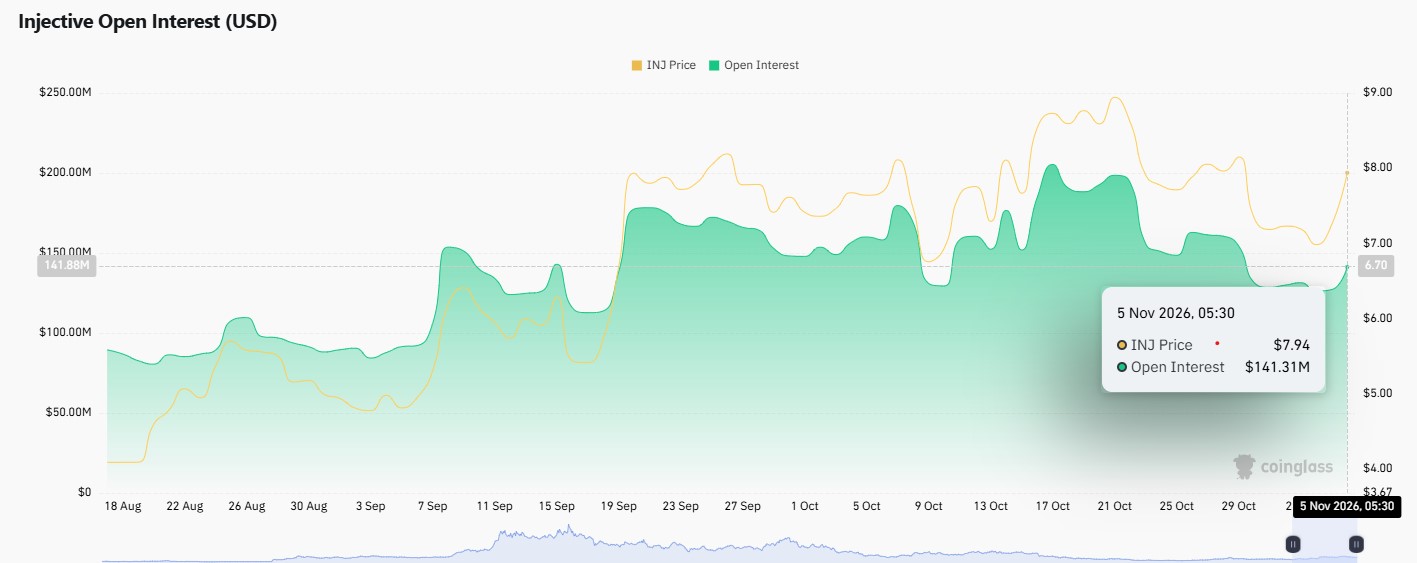
Source: CoinGlass, $INJ open interest chart, Nov 5, 2026, 05:30 UTC
Open interest is going up along with price, so new traders are opening positions instead of just closing old ones.
INJ Technical Analysis: Falling Wedge Breakout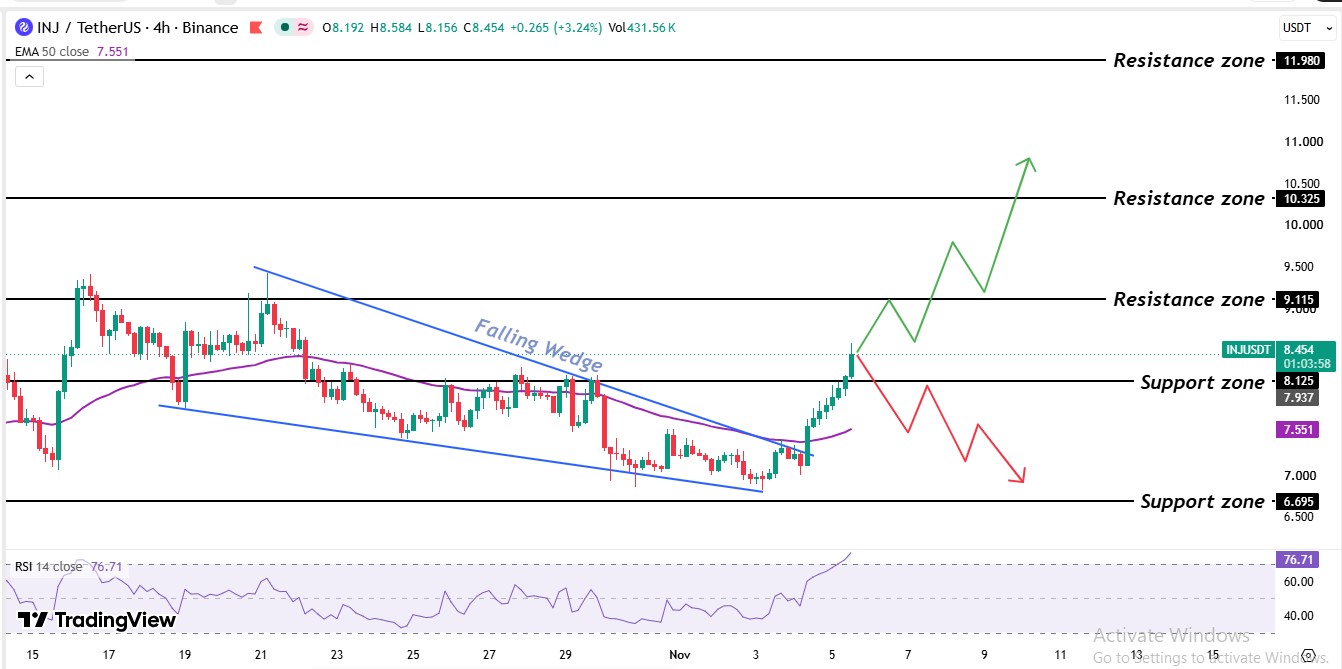
Source: TradingView, $INJ/USDT 4H, Nov 5, 2026, 11:00 UTC
The Binance 4H chart for INJ/USDT on TradingView, captured Nov 5, 2026, 11:00 UTC, frames this Injective price prediction. A sharp October rally spiked to the $9.40 level before sellers took control.
Price then slid inside a falling wedge, two sloping trendlines that squeeze price toward a breakout. The market tried many times to break the upper trendline, but sellers defended it until Nov 4.
The price bottomed near the $6.85 level, above the $6.695 support zone. A strong green candle on Nov 4 then broke the upper trendline of the wedge and pushed through the $7.551 4-hour 50 EMA level, where sellers had capped earlier bounces.
The $INJ 50 EMA sits at $7.551, and INJ's $8.454 price trades 12.7% above it. The latest 4-hour candle trades above the EMA level.
The $INJ RSI reads 76.71 on the 14-period 4-hour setting. Above 50 means buyers hold the edge. Above 70 means overbought, where a pullback often follows.
INJ Support Levels and Resistance Levels
Level | Role |
$11.980 | Resistance |
$10.325 | Resistance |
$9.115 | Resistance |
$8.125 | Support |
$7.551 | 50 EMA |
$6.695 | Support |
Injective Price Prediction: Bull, Base, and Bear Scenarios
Scenario | Trigger | Target | Invalidation |
Bull | 4-hour candle trades above $9.115 | $10.325 | Back under $8.125 |
Base | Range of $8.125 and $9.115 | Range | Range breaks |
Bear | 4-hour candle trades under $8.125 | $7.551, $6.695 | Reclaims $8.125 |
The bull case needs an $8.125 level to hold first. The bear case gains weight if RSI drops under 50.
Regulatory delay is a risk, since a slipped INJC launch removes the main catalyst. ETF-flow reversal is another, because net outflows would force the fund to sell $INJ. A 4-hour candle under the $8.125 level would turn the breakout into a false breakout, a move that clears a level and then fails.
Injective Price Outlook: Expert view
As per CoinGabbar analysis, the Injective price prediction leans bullish, while $INJ holds above the $8.125 level. a $7.551 EMA now below price, and $530.07K of short liquidations back that view.
The breakout points straight to $9.115. RSI at 76.71 argues for a retest of $8.125 first.
The condition to watch is a 4-hour candle trading under the $8.125 level, which would end the squeeze and hand control to sellers.
YMYL Disclaimer: This article is for educational and informational purposes only. It does not offer financial advice, price guarantees, or return promises. Crypto assets are volatile