Magma Finance Price Prediction: Is Bithumb a Catalyst for $MAGMA?

Can a token that's up 45.72% in a week keep its gains after a Korean listing?
That's the test behind this Magma Finance price prediction at 11:20 UTC on Nov 5, 2026, with MAGMA trading near $0.38.
Buyers tagged $0.4595 on the Bitget daily chart before sellers took over. An earlier Magma forecast covered the setup before this spike.
MAGMA Price Analysis: Market Data Snapshot
CoinMarketCap data shows Magma Finance ranked 251st, trading at $0.3861 after a 2.22% gain in 24 hours. The daily range ran from $0.3772 to $0.447.
Market cap is $118.5M. Fully diluted value is $386.24M, since only 306.87M of the 1B supply circulates.
Volume jumped 269.5% to $4.35M, yet that's just 3.65% of market cap. Thin.
MAGMA price today sits 52.01% under the $0.8058 all-time high and 454.79% above the $0.06971 low. Any MAGMA price analysis starts from that gap.
Why Is MAGMA Moving Today?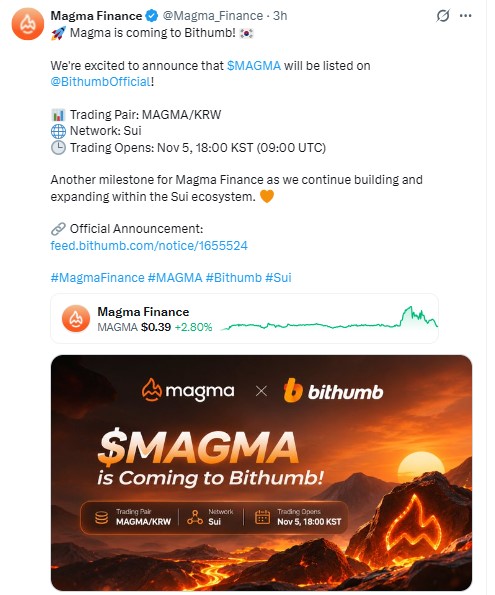
Bithumb is listing MAGMA. The pair is MAGMA/KRW, the network is Sui, and trading opened at 09:00 UTC on Nov 5, 2026, per the project's X announcement.
That's 18:00 KST. Korean retail traders can push small caps hard on listing days. They did.
Price spiked to $0.447, then slipped. Coinglass shows -5.44% over the latest 4 hours, while the 24-hour reading still holds +2.36%.
But the weekly gain of 45.72% matters more, and the Bithumb listing sits inside it.
And no other catalyst shows up in the data.
Magma Finance Technical Analysis: Range to Rejection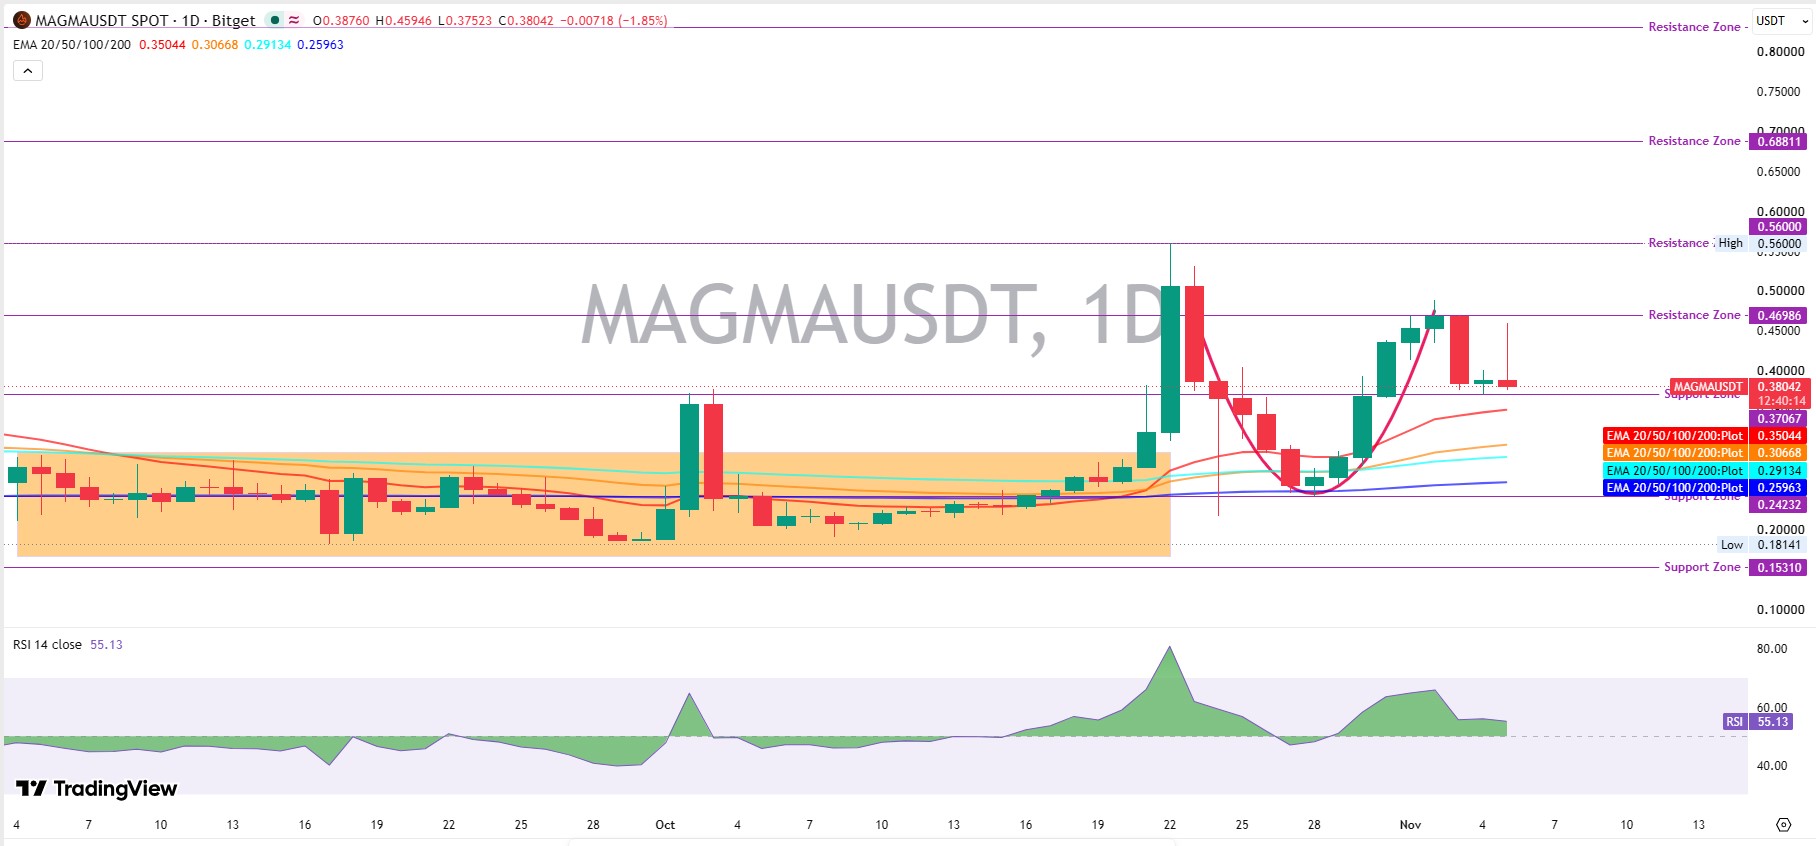
For this technical analysis, the daily TradingView chart for MAGMAUSDT on Bitget tells a clear story. From early September through Oct 21, the price sat between the $0.18141 low and roughly the $0.30 zone.
EMAs (exponential moving averages, lines that weight recent prices more) tangled together. RSI stayed mostly under 50.
A spike on Oct 2 ran to about $0.37, then met sellers on Oct 3. That carved out the $0.3707 level that matters now.
Then on Oct 22, a vertical candle carried the price from about $0.32 to near $0.50, tagged $0.56 intraday, and pushed RSI to roughly 80.
Overbought, as expected. Sellers answered on Oct 23, and on Oct 24, they printed a deep wick toward $0.22.
But dip buyers defended the $0.24232 support zone, just under the 200 EMA at $0.25963, and the price carved a rounded bottom by Oct 28.
From there, the price climbed in a steady arc through the 20 EMA. The Nov 2 candle wicked to about $0.49 into the $0.46986 resistance zone and couldn't stay above it.
A heavy red candle followed on Nov 3. Then today's wick, a long one, reached $0.45946 before sellers shoved the price back to $0.38042.
That wick reads like clean rejection. Then again, the price still trades above every EMA.
A detail stands out. All four EMAs sit below price in stacked order, with the 20 EMA at $0.35044, 50 EMA at $0.30668, 100 EMA at $0.29134, and 200 EMA at $0.25963.
RSI cooled from near 80 to 55.13. Momentum reset without breaking.
Magma Finance Price Prediction: Key Support and Resistance Levels
Support starts at $0.3707; the level trading is testing right now. Under it sit the 20 EMA at $0.35044, the 50 EMA at $0.30668 and the $0.24232 base.
Resistance starts at $0.46986. Starts, because that zone rejected the price on Nov 2 and capped today's wick. Above it sit $0.56 and $0.68811.
Breakout needs a daily candle trading above $0.46986 on rising volume. Breakdown needs trading under $0.3707 and staying there.
Readers comparing setups can cross-check other crypto price predictions for similar-level logic.
Derivatives Flow and Liquidations
At 11:20 UTC, Coinglass data shows a futures volume of $59.72M against a spot volume of $762.64K, about 78 times more. Open interest sits at $30.79M, and Binance handled $32.03M of the flow.
Binance's long/short account ratio reads 1.1801, so longs lean slightly ahead. Top-trader positions read 1.1637.
And what happens when leveraged buyers and spot sellers want out together?
Liquidations over 24 hours total $133.12K, with shorts at $91.12K and longs at $42.00K. But the latest 4 hours flipped, with longs at $40.05K and shorts at $35.13K.
MAGMA Price Forecast Scenarios
This Magma Finance price prediction leans neutral while $0.3707 holds, and the MAGMA price forecast below ties every target to a level. Fresh exchange listing updates change liquidity fast.
Scenario | Trigger | Target | Invalidation | Liquidity Condition |
Bull | Daily candle trading above $0.46986 | $0.56, then $0.68811 | Trading back under $0.3707 | Spot volume above $4.35M and rising |
Base | Price holds $0.3707 and stays under $0.46986 | Range of $0.3707 to $0.46986 | Breakout or breakdown of either level | Futures-led flow near $59.72M |
Bear | Daily candle trading below $0.3707 | $0.35044, then $0.30668 and $0.24232 | Daily candle back above $0.3707 | Thin spot flow, rising long liquidations |
MAGMA Price Outlook and Price Projection
The MAGMA price outlook for the coming week favors the base range of $0.3707 to $0.46986, with RSI at 55.13 leaving room in both directions.
A MAGMA price projection toward $0.56 needs a breakout first. Without it, that number is only a chart label.
Narrative rotation matters for small caps, so AI token news and similar sector headlines can shift liquidity between names.
On-Chain Holder Data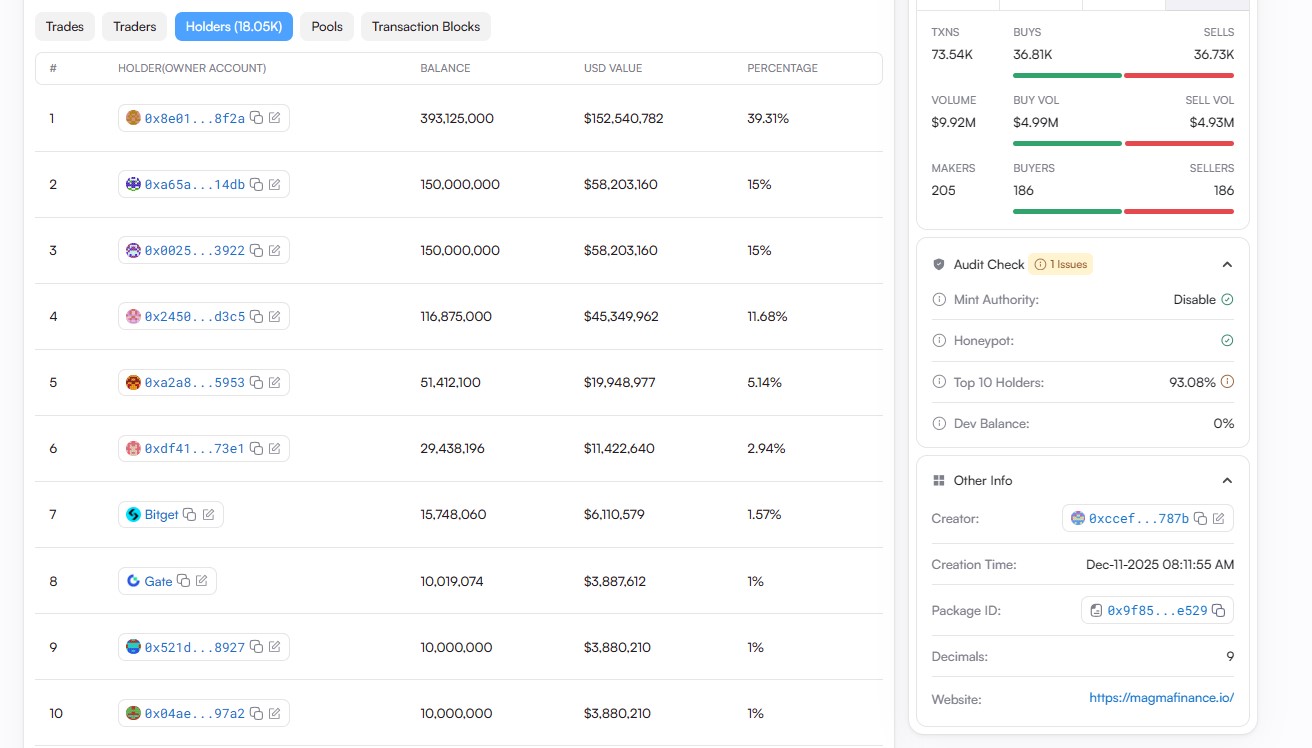
Suivision holder data lists 18.05K holders, but concentration is extreme. The top wallet holds 393,125,000 MAGMA, or 39.31%, and the next two wallets hold 15% each.
The top 10 together hold 93.08%. Dev balance is 0%, mint authority is disabled, and the honeypot check is clear, though the audit panel flags an issue.
Trading in the on-chain window reads balanced, with 36.81K buys against 36.73K sells and $4.99M buy volume against $4.93M sell volume.
Risks That Change the Outlook
Several risks cap this Magma Finance price prediction. Wallet concentration tops the list, since a single large transfer can overwhelm $4.35M of daily volume.
Listing pops fade fast when spot demand stays thin. And $0.3707 isn't a wall, only a level, so a daily candle under it flips the bias.
Risk appetite across memecoin market news also swings altcoin liquidity, and Bitcoin context isn't part of this data.
Disclaimer: This article is for information only and isn't financial advice. Crypto prices swing fast, and readers should do their own research before making any trade.