Magma Finance Price Prediction 2026: Can MAGMA Reclaim $0.60?


Any Magma Finance price prediction has to start with where $MAGMA sits right now. MAGMA traded near $0.51 as of the September 2, 2026 snapshot (around 16:48 UTC), based on data from CoinMarketCap and the daily TradingView chart. That's a rally of more than 43% in 24-hours.
Turns out, the move follows weeks of chop inside a falling price channel. The trend right now leans bullish, with $MAGMA sitting just under the resistance zone at $0.576. Support holds near the $0.338 EMA line below.
The main catalyst? Magma 2.0 and its new Prop AMM design. The main risk? Three wallets alone hold 81% of the total supply. That's not small.
Quick Prediction Box
Metric | Current Outlook |
Current Price | $0.51 |
Trend | Bullish (short term) |
Immediate Target | $0.576 resistance zone |
Next Target | $0.84 (1.618 Fib extension) |
Support | $0.338 (EMA20) and $0.156 zone low |
Resistance | $0.576, then $0.84 |
RSI | 65.29, not yet overbought |
Bull Case | A break above $0.576 opens $0.84 to $1.00 |
Base Case | Range between $0.34 and $0.58 |
Bear Case | Slide back to the $0.20 to $0.30 zone |
Invalidation | Daily trade below $0.32 |
Magma Finance Price Prediction Today
MAGMA Current Price and Market Data
Crypto prices move fast, so treat these figures as a snapshot from September 2, 2026, near 16:48 UTC, sourced from CoinMarketCap's live data.
MAGMA traded at $0.5101, up 43.18% on the day.
Market cap stood at $96.85 million, against an unlocked market cap of $145.6 million.
24-hour volume came in at $4.09 million on centralized exchanges, up 72.49%. On-chain trackers showed roughly $12.65 million in separate decentralized exchange (DEX) volume over the same window.
The circulating supply sits at 190 million MAGMA out of a fixed one billion maximum supply, just 19% unlocked.
The all-time high (ATH) is $0.8058, set on July 4, 2026. The current price sits about 37% under that peak. The all-time low (ATL) of $0.06971 came on April 3, 2026. $MAGMA sits over 600% above that bottom.
Why Is MAGMA Price Moving Today?
Magma 2.0 and Protocol Development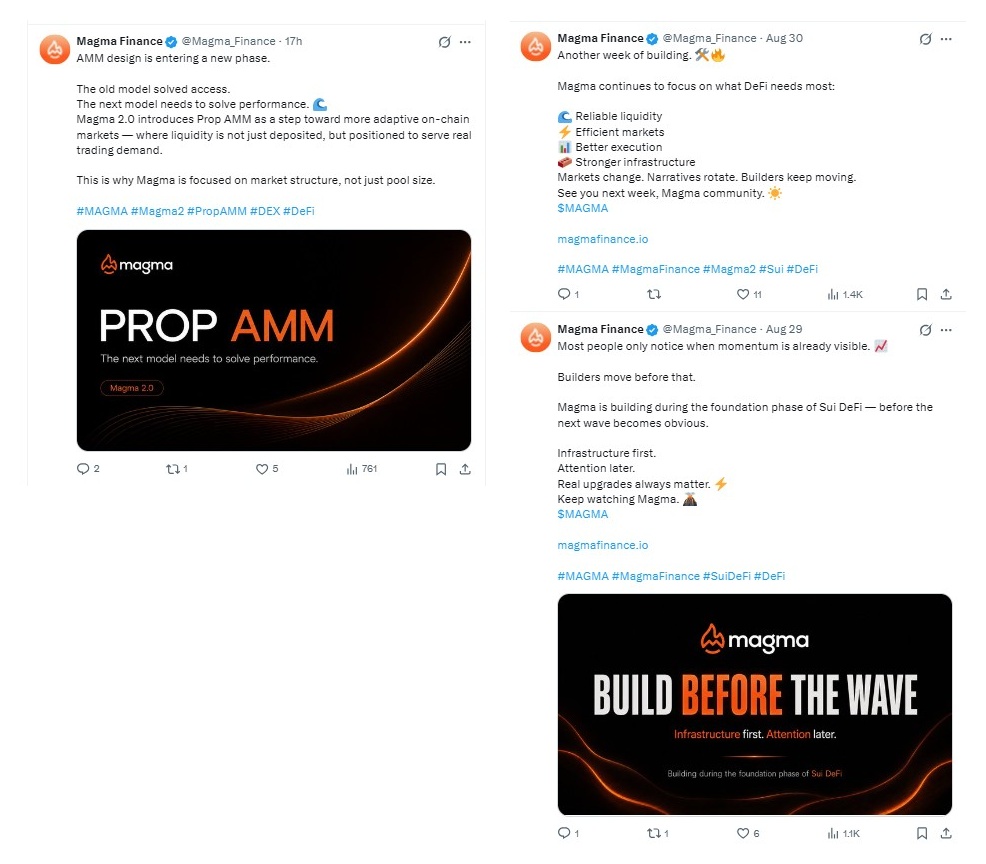
Magma Finance's official update on X described its new Prop AMM, an automated market maker (a system that sets crypto trading prices using pooled funds instead of a traditional order book), as the next phase of on-chain liquidity design. The old model solved access. The new one targets execution and performance instead.
The protocol also runs an AI-driven strategy layer behind its liquidity engine, a detail worth tracking alongside broader AI token sector news.
Sui DeFi Market Momentum
Sui DeFi (decentralized finance built on the Sui blockchain) has been building quietly through 2026. Magma keeps positioning itself as core plumbing for that ecosystem. Momentum tends to show up only once it's obvious. Builders move first.
MAGMA Trading Volume and Liquidity
Volume jumped alongside price, a healthy pairing. But liquidity remains thin, roughly $2.05 million in the primary Sui pool against a market cap north of $96 million. That gap matters for anyone trading real size.
Buy-side activity edged ahead too, with 29,170 buys against 23,720 sells over the past day. For context on the earlier leg of this move, today's rally explainer covers what sparked it.
$MAGMA Technical Analysis
That upper-band ride lines up with the broader descending channel $MAGMA has traded inside since July. 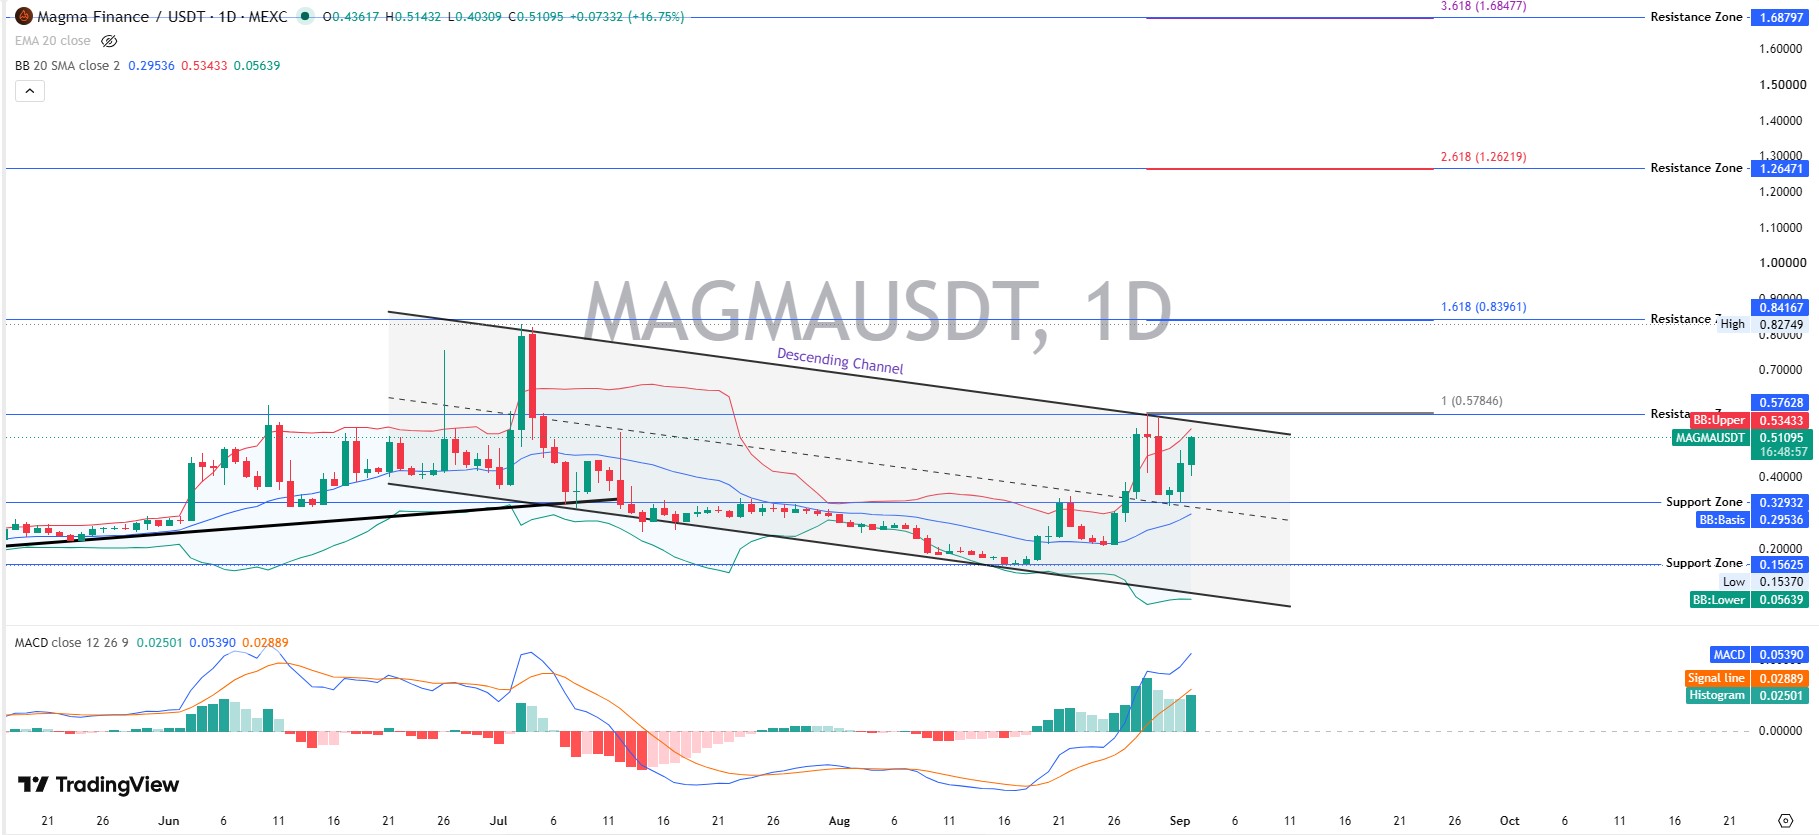
The chart shows price breaking above the channel's upper trendline in late August, a structural shift worth watching alongside the resistance zone just overhead. Widening bands after a squeeze near the basis line, as seen through July and August, often precede exactly this kind of directional move.
MAGMA Support Levels
The 20-day EMA (Exponential Moving Average, a trend line that reacts faster to recent trades than a simple average) sits at $0.338 and has flipped into support. Below that, the wider support zone runs from $0.156 to $0.329.
MAGMA Resistance Levels
Immediate resistance sits at the $0.576 zone, lining up with the 1.0 Fibonacci extension near $0.578. Above that, $0.84 and then $1.26 come into view if buyers keep pushing. Watch the live MAGMA chart for how these levels hold.
RSI and Momentum
RSI (Relative Strength Index, a momentum gauge from zero to a hundred) reads 65.29 on the daily. Not overbought yet. But it's close enough that a stall near resistance wouldn't shock anyone. So, is $MAGMA already stretched too far, too fast?
Moving Averages
Price trades well above its EMA20, and that gap alone reads as a bullish signal.
Bollinger Bands
Bollinger Bands (a volatility indicator plotting an upper and lower band around a moving average) show the upper band at $0.534, the basis line at $0.295, and the lower band at $0.056 on the daily chart. Price is trading right at the upper band, which usually signals strong momentum rather than a reversal on its own.
MACD
The MACD (Moving Average Convergence Divergence, a trend-momentum indicator) line sits above its signal line, at 0.0539 versus 0.0289, with a rising green histogram. Momentum's building. Fine.
Volume Confirmation
The breakout came with real volume behind it, not a quiet drift. That's the difference between a genuine move and a fakeout, a distinction covered in more depth in the 53% surge breakdown.
MAGMA Price Prediction 2026
Scenario | Target Range | Condition |
Bear Case | $0.20 to $0.30 | Support zone breaks, momentum fails |
Base Case | $0.40 to $0.58 | Range-bound consolidation continues |
Bull Case | $0.65 to $0.84 | Resistance zone clears on volume |
Can MAGMA Reach $1?
Getting to $1 from roughly $0.51 needs close to a 96% gain. At $1, with 190 million tokens circulating, market cap would land near $190 million, about double today's figure.
If the full one billion supply gets counted instead, fully diluted valuation (FDV, the theoretical market cap if every token were unlocked) at $1 would hit one billion dollars.
That's a stretch from today's $509.74 million FDV. It would take sustained Sui adoption, a fresh market cycle, and $MAGMA clearing its old ATH of $0.8058 first. Possible. Not guaranteed. A dedicated look at reaching the one-dollar mark walks through the math further.
MAGMA Price Prediction 2027
By 2027, three things decide the outcome: Sui ecosystem growth, how Magma 2.0 performs against rival DEXs, and whether token unlocks get absorbed without dumping the price. If liquidity deepens and adoption holds, a range between $0.60 and $1.20 looks fair. And if DEX competition on Sui intensifies instead, $MAGMA could just as easily grind sideways. For a wider view across tokens, the broader price prediction hub tracks similar setups.
MAGMA Price Prediction 2030
Don't just stretch today's chart four years forward; that's lazy math. By 2030, MAGMA's value depends on where Sui DeFi's total market lands, how much of the one billion supply has actually been unlocked, and whether Magma still leads its niche.
A modest scenario puts market cap in the $300 to $600 million range. A stronger DeFi cycle, paired with real adoption, could push that toward $1 to $2 billion in FDV. Neither outcome is promised.
$MAGMA Bull Case vs Bear Case
Bull Case
Breakout holds, resistance at $0.576 gives way, and volume keeps confirming the move.
Base Case
Price chops between $0.34 and $0.58 while the market waits for a clearer signal.
Bear Case
But whale wallets sell into strength, support at $0.338 fails, and price retests the $0.20 zone, echoing the setup covered in losing ground in Sui DeFi.
What Would Invalidate the Bullish Thesis?
A daily trade below $0.32 breaks the current structure. And a sustained trade under the EMA20 would tell a very different story than the one this rally's been telling.
MAGMA Tokenomics and Whale Risk
MAGMA's total and max supply sit fixed at one billion tokens. The circulating supply is 190 million, leaving 81% still locked or unreleased.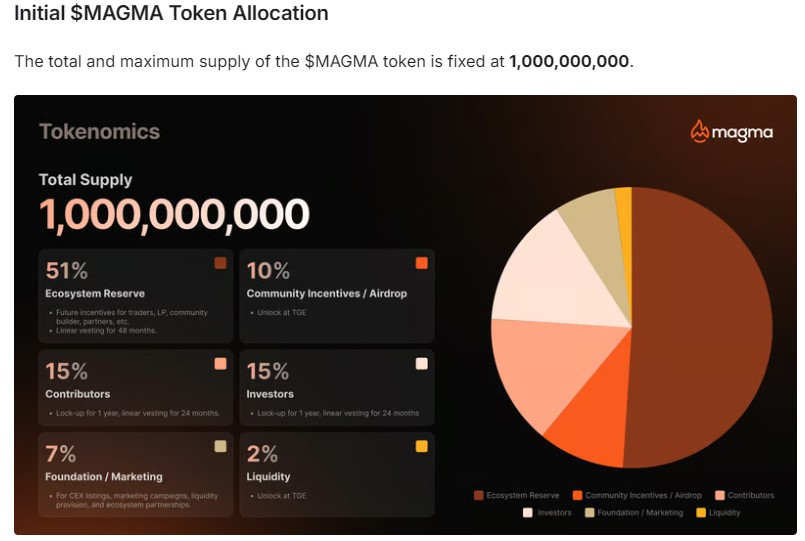
The unlock schedule, per Magma's own allocation chart: 51% ecosystem reserve on a 48-month linear vesting; 10% community incentives unlocked at launch (worth checking against active airdrop opportunities elsewhere); 15% contributors and 15% investors both under a one-year lock plus 24-month vesting; 7% foundation and marketing reserved partly for new exchange listings; and 2% liquidity unlocked at launch.
Whale concentration is the sharper near-term risk. 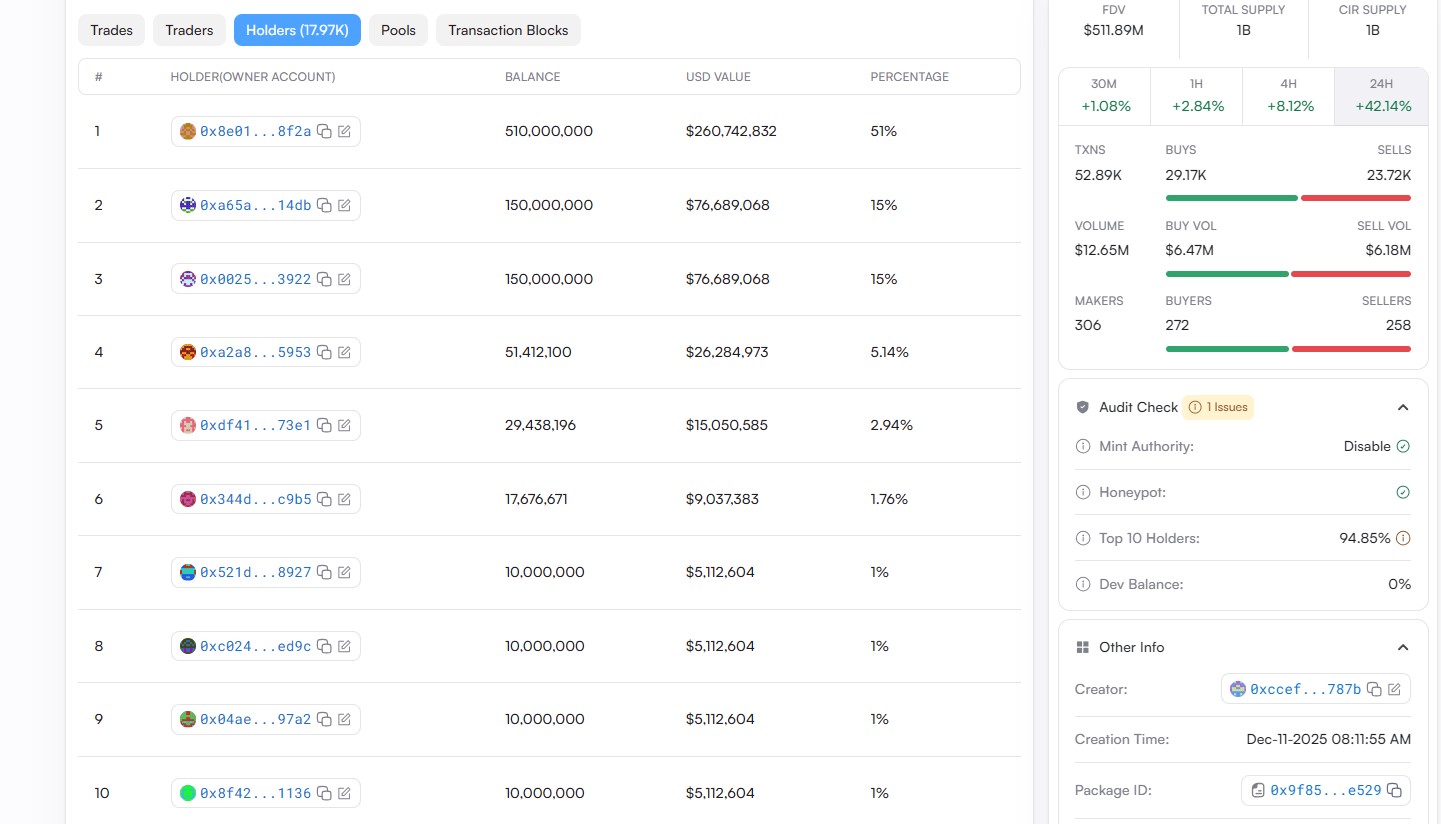
On-chain holder data on SuiVision shows the top three wallets control 81% of total supply between them, and the top ten hold almost 95%. Dev balance reads zero, a small point in Magma's favor. Mint authority is disabled, and the contract isn't flagged as a honeypot, though one audit item remains open for review.
Key Risks for $MAGMA
Whale concentration tops the list, followed by future unlocks that could add sudden sell pressure.
Liquidity stays thin against market cap, raising slippage risk on larger trades.
Sui ecosystem competition isn't fading, and neither is MAGMA's link to wider Bitcoin market trends or sudden rotations into memecoin market news elsewhere in the cycle.
Leverage adds one more layer. Liquidation data over the past day, tracked on CoinGlass, showed $360.42K wiped out, with short positions taking the bigger hit at $236.97K. That's a squeeze, not a crash.
$MAGMA Price Targets and Invalidation Levels
Level | Meaning |
Support 1 | $0.338 (EMA20) |
Support 2 | $0.156 to $0.329 zone |
Resistance 1 | $0.576 |
Resistance 2 | $0.84 |
Bullish confirmation | Daily trade above $0.58 with volume |
Invalidation | Daily trade below $0.32 |
Anyone tracking this setup around a specific date should also flag upcoming token events, since scheduled unlocks can shift these levels fast.
Trader Takeaway
Above $0.58, bullish confirmation kicks in.
Between $0.34 and $0.58, call it consolidation, nothing more.
Below $0.32, bearish risk returns fast.
High volume on any breakout matters more than the breakout itself. Weak volume calls for caution on any rally.
Disclaimer
This article is for informational purposes only and isn't financial advice. Crypto markets are volatile, and prices can swing sharply in either direction. Do your own research and talk to a licensed financial advisor before making investment decisions.
















