Momentum Price Forecast: Can Spot Buyers Replace Futures Traders?


Who's really pushing Momentum higher, and what happens when that buyer steps away?
The previous Momentum breakout call named two targets, and the price has now tagged both. So the Momentum price forecast hinges on a tougher question than before, which is who funds the next leg.
Market Data Check After the 24H Jump
At 10:53 UTC, on 20 Nov, CoinMarketCap's MMT page lists Momentum price today at $0.2522, up 27.55% in 24 hours. Market cap is $51.47M, ranked 316th.
Volume reached $271.06M, or 517.65% of market cap.
And the 24h range runs from $0.1958 to $0.3119. Price sits 170.47% above its all-time low from 6 days ago.
Still, that's 93.78% under the $4.16 peak from a year ago.
Why Is MMT Up Today While Bitcoin Falls?
Bitcoin trades at $61,969.80, down 3.02%, and its 24h volume rose 28.08%. Traders tracking the Bitcoin price prediction know that kind of drop usually drags altcoins lower.
But MMT rose 27.55%.
The Fear and Greed Index sits at 11, extreme fear, so the broader market isn't what's pulling this token up. Something token-specific is, and that's the core of why MMT is up today.
MMT HTX Listing Hits Spot Trading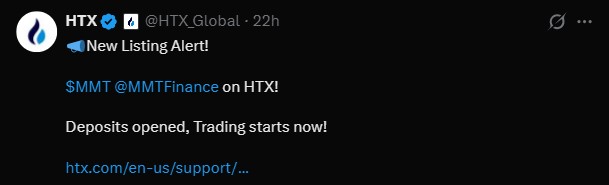
What the HTX Post Confirms
HTX lists MMT. Deposits are open. Trading started.
The HTX listing post went up 22 hours before, and its visible text names no pair and no price. Only access is confirmed.
New venue. New buyers can arrive. Early sellers can too.
Why Listing Days Distort Spot Flow
Every new crypto exchange listing brings noisy spot numbers, since volume splits across more exchanges and arbitrage trades pile in.
So the MMT HTX listing may explain part of the negative spot flow, but it can't prove weak demand.
Spot vs Futures Flow Check
Spot net inflow, the gap between buying and selling volume, is -6.9M. Futures net in flow is +17.0M. Buyers on futures are doing the work.
CoinGlass futures data puts MMT open interest, the total value of live futures contracts, at $55.75M, up 17.3%. That's 106.67% of market cap.
Futures volume is $1.07B against $143.02M on the spot. A 7.4x gap.
Binance carries $25.30M of the open interest, up 20.2%. And Bitget and MEXC grew faster, up 29.5% and 41.6%.
Funding, the fee that keeps futures near spot price, sits at -0.0113%, so shorts still pay longs. Who buys $0.3188 if the spot stays negative?
Liquidations Flipped From Shorts to Longs
Shorts took 65% of the $4.54M wiped out over 24 hours, or $2.94M. But the last 12 hours tell a different story, with longs losing $626.56K against $402.17K for shorts.
That was a short squeeze, where a rising price forces shorts to buy back. It's done now.
Squeezes rarely stay lopsided, and the Movement breakout levels cover another fast small-cap breakout for comparison.
Holder Count and the Binance Wallet Quirk
BscScan holder data shows 435 holders on the BNB Chain version, up from 420 in the last Momentum report.
But a Binance wallet holds 98.86% of that 15M supply. That's exchange custody, not a whale, and it says nothing about demand.
Momentum Price Forecast and the Ascending Channel Walk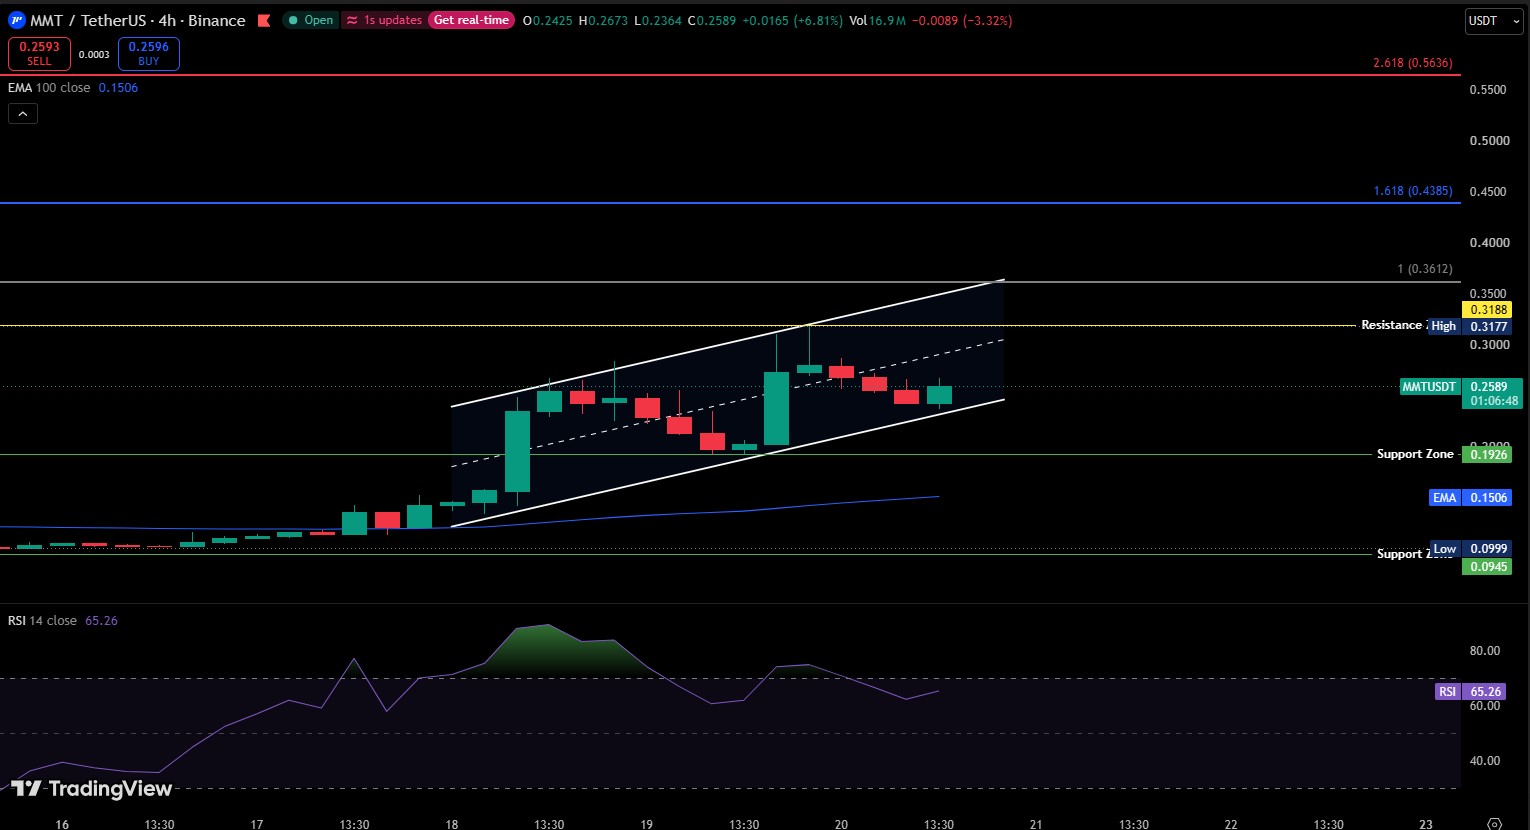
The TradingView 4H chart starts flat, with tiny candles near $0.10 above the $0.0945 support zone, a level where buyers stepped in before.
Then EMA 100, an exponential moving average that weighs recent candles more, began rising toward $0.1506, and a single large green candle broke the base.
That candle opened a rising channel, a pair of parallel lines tilting up. Price pulled back to the floor near $0.1926, then bounced hard.
A second leg ran to $0.3177, a hair under resistance at $0.3188 on the upper line, where sellers have stepped in before. RSI peaked in the high 80.
Sellers then pushed the price through four straight red candles to $0.2364. The latest candle opened on Nov 20 at $0.2425 and trades at $0.2589.
At first glance, that's a top forming. Then again, RSI fell to 65.26 while the price still held the lower rail, which is a reset.
Price now sits about 72% above EMA 100.
Momentum Price Forecast Scenarios and Targets
The crypto price prediction hub tracks other coins, but this token's call hinges on a single line, $0.3188.
Scenario | Trigger | Target | Invalidation | Liquidity Condition |
Bullish | Trades above $0.3188 | $0.3612, then $0.4385 | Back below $0.3188 | Spot net inflow turns positive |
Base | Holds channel floor | $0.3188 retest | Below $0.1926 | Futures volume cools |
Bearish | Channel floor breaks | $0.1926, then $0.1506 | Reclaims channel floor | Long liquidate, spot stays negative |
Momentum Price Forecast Support Zones
The MMT support and resistance map is tight. $0.1926 comes first, 25.6% below $0.2589, then EMA 100 at $0.1506.
Resistance Levels and MMT Price Target
Resistance sits at $0.3188, 22.7% higher. Fibonacci extensions, ratios drawn from a past swing to mark common stall zones, add $0.3612 and $0.4385 as the next MMT price target areas.
Risks That Cap the Rally
Circulating supply is 204.10M of 1B MMT, and FDV, the value of every token at today's price, is $252.36M. Liquidity to market cap is 0.41%, so big orders move the price fast.
Binance top traders hold longs at a 2.0642 position ratio, up from 1.6765 in the last report, while regular accounts stay short at 0.8681. That's a heavy long exposure.
Fresh headlines hit thin tokens hard, so traders can track AI crypto news for sudden sentiment turns.
Where the MMT Setup Stands
Structure is bullish. The tape is futures-driven, and the spot hasn't voted yet.
A hold above the channel floor keeps $0.3612 and $0.4385 alive. A break puts $0.1926 on the table, and the Momentum price forecast turns bearish there. Sharper moves on smaller tokens turn up in memecoin crypto news.
Disclaimer: This article is for information only and isn't financial advice. Crypto prices are volatile, and readers should do their own research before making any decision.