NEAR Protocol Price Prediction: Can Bulls Clear the $4.80 Cap?


Can NEAR finally push through the $4.80 ceiling that has capped every bounce since Oct 12 UTC?
This NEAR Protocol price prediction was written on Oct 28, 2026, at 10:30 UTC, with a price near $4.70. It builds on the October 2026 NEAR forecast but reads a fresh chart.
Bias is bullish while the price trades above $4.622. Below it, the setup flips quickly.
NEAR Price Today: Data Snapshot at 10:30 UTC
NEAR price today reads $4.70, based on CoinMarketCap NEAR data and Coinglass, pulled on Oct 28, 2026, at 10:30 UTC.
Metric | Value |
Price | $4.70 (+6.72% in 24h) |
24h range | $4.39 to $4.77 |
Market cap | $6.15B (rank 16) |
24h volume | $662.95M |
Futures open interest | $1.36B |
All-time high | $20.42 (Jan 17, 2022) |
Volume equals 10.79% of market cap, so trading hasn't dried up. Circulating supply matches total supply at 1.31B NEAR.
Breaking: NEAR Reclaims $4.70
Buyers are back. NEAR gained 6.72% in 24 hours and tagged $4.77.
Shorts paid for it. Of the $2.41M liquidated in 24 hours, $2.15M came from short positions, about 89%.
Still red on 7 days at -4.54%. The 30-day change reads -12.55%.
But the move is still early. Fresh AI crypto headlines keep NEAR in the conversation, yet price needs proof.
NEAR Technical Analysis: A Triangle Running Out of Room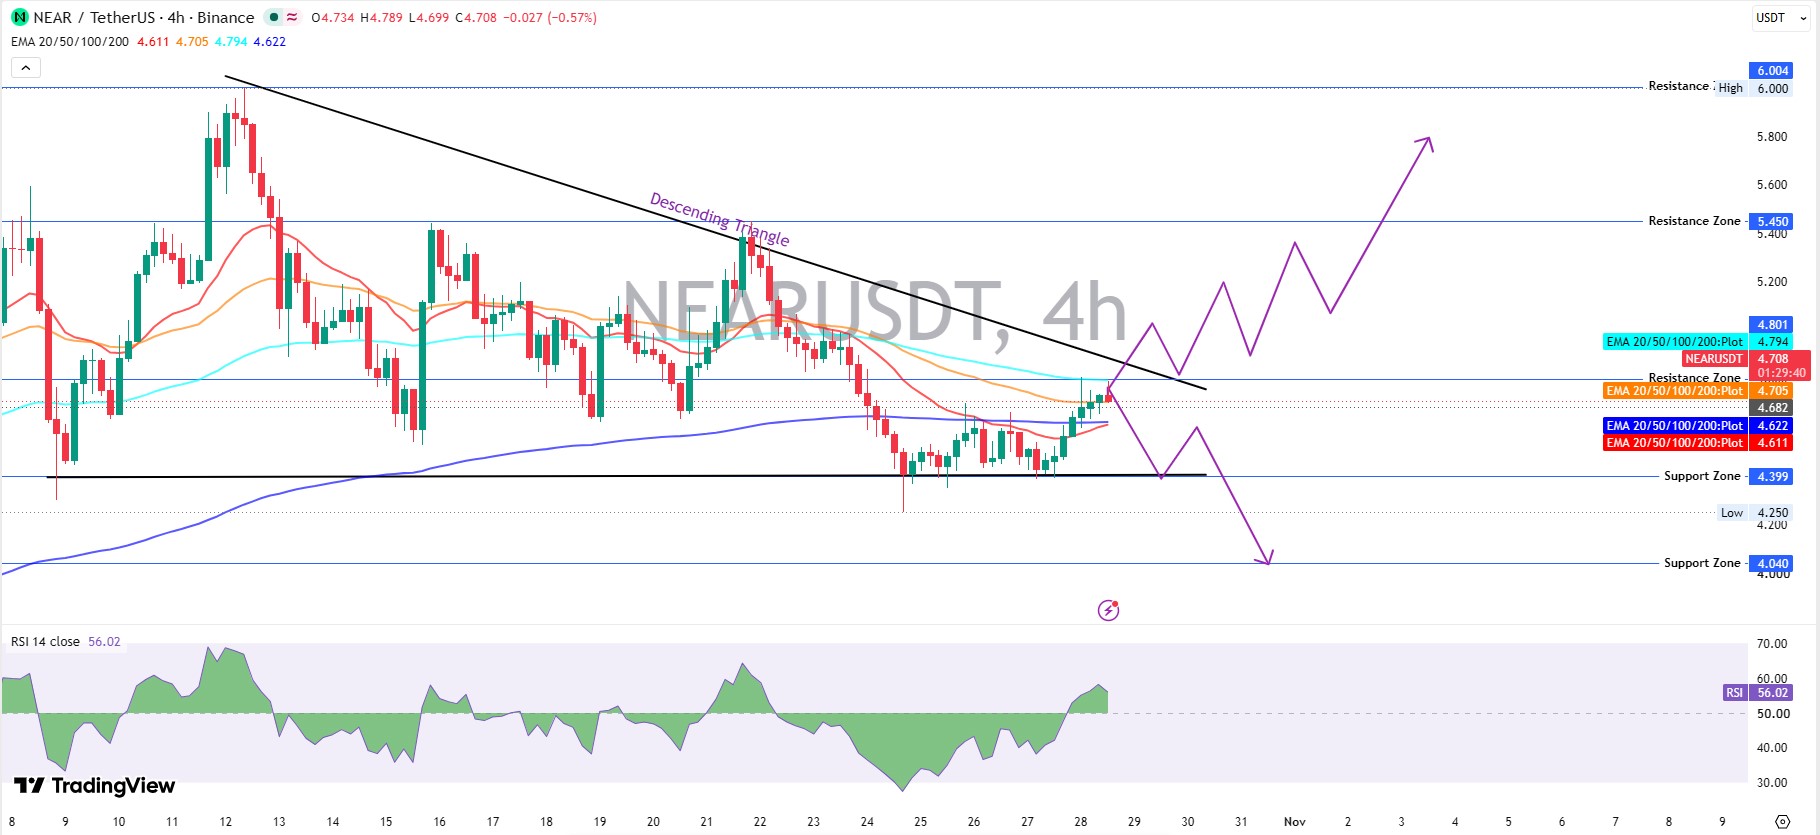
This NEAR technical analysis reads the 4-hour NEARUSDT chart on Binance.
Price sits inside a descending triangle on the TradingView NEARUSDT chart, a pattern with a flat floor near $4.399 and lower highs pressing down.
Sellers pushed the price to a $4.250 low on Oct 24. Buyers answered.
An EMA, short for exponential moving average, tracks the trend while weighting recent trades more heavily. Price trades over the 20 EMA at $4.611 and the 200 EMA at $4.622, and it sits level with the 50 EMA at $4.705.
The 100 EMA is a different story, since it sits at $4.794, right under the falling trendline.
RSI, a 0 to 100 momentum gauge, reads 56.02 and has climbed back over 50.
That reads like a breakout. On second thought, a setup isn't a break, and the $4.794 to $4.801 band still blocks the way. And the falling trendline hasn't broken.
NEAR Support and Resistance: Levels That Decide the Week
NEAR support and resistance are easy to map. Support sits at $4.399 and $4.040, while resistance stacks at $4.794, $4.801, $5.450, and $6.004.
The floor at $4.399 has held on every test since Oct 24.
And the earlier $4.44 support test covered the first hit on that zone.
Leverage Is Steering the Rally
CoinGlass derivatives data shows $1.35B in futures volume against $209.50M in spot, about 6.4 times as much.
Open interest, the total value of live futures contracts, sits at $1.36B. That's 22% of market cap.
Binance top traders hold a long/short position ratio of 2.4982, so big accounts lean long. Those short liquidations were a small short squeeze, meaning forced buying that lifts price. So who keeps buying when the shorts are gone?
Spot volume says the crowd hasn't piled in.
NEAR ETF Streak Snaps at 4 Days
The Bitwise NEAR ETF, ticker NRR on NYSE, saw a $4.84M net outflow on Oct 27, per SoSoValue ETF flows. It ended four straight inflow days.
Cumulative inflows slipped to $84.83M from $89.67M. Net assets sit at $77.91M, about 1.29% of NEAR's market cap.
But a single red day isn't a trend. A repeat on Oct 28 would change the tone.
Private Trading Push Hands Bulls a Story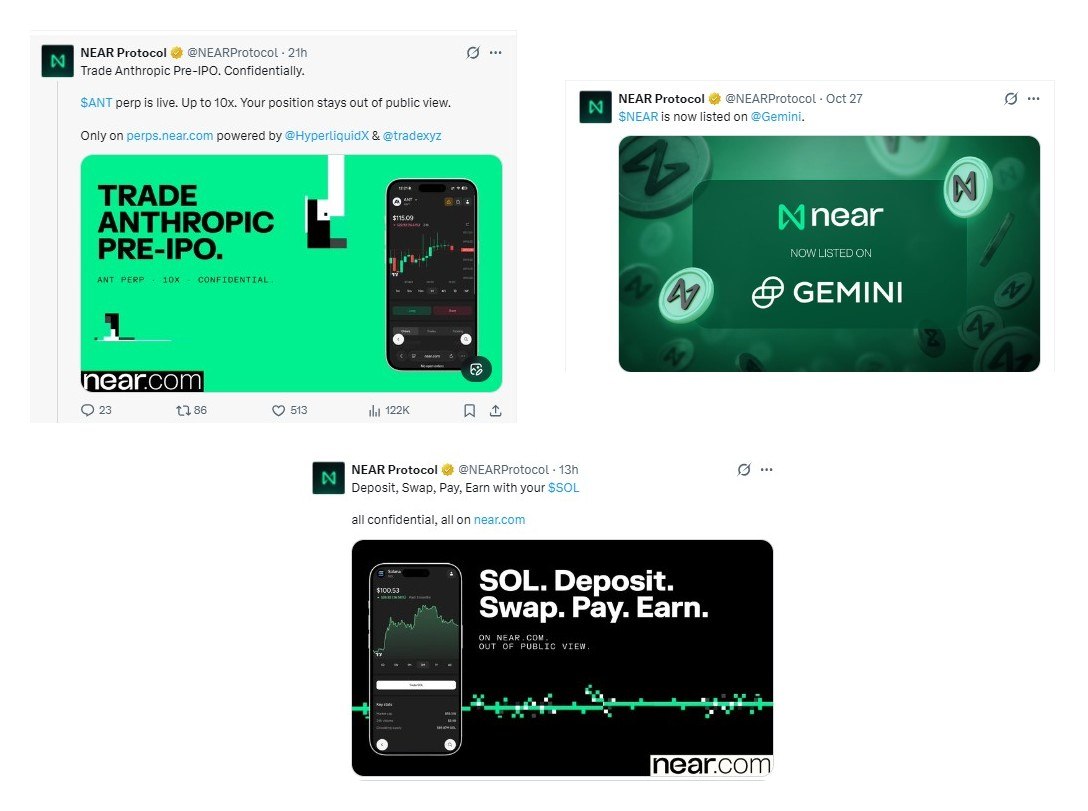
NEAR Protocol spent Oct 27 pushing confidential trading on near.com.
The official NEAR X post says an Anthropic pre-IPO perpetual is live at up to 10x, with positions hidden from public view. A later post added confidential SOL deposits, swaps, and payments.
NEAR was also listed on Gemini that day. More venues give buyers more doors, but spot trading hasn't caught up with futures.
NEAR Protocol Price Prediction for the Next 7 Days
For the 24 hours, the range is $4.622 to $4.801. A hold over $4.622 keeps bulls in charge.
A push above $4.801 ends the range, though.
Over 7 days, a break and hold above $4.801 targets $5.450. Daily volume needs to top the $662.95M seen today.
Beyond $5.450 sits the old zone from the earlier $5.59 resistance test.
Failure at $4.801 sends price back to $4.399. And a break there opens at $4.250, then $4.040.
Scenario Table for the Next Move
Bulls also want proof of demand, like a repeat of the NEAR Intents volume rally.
Scenario | Trigger | Target | Invalidation | Liquidity Condition |
Bullish breakout | Trades above $4.801 and holds | $5.450, then $6.004 | Trades below $4.622 | Shorts squeezed, volume over $662.95M |
Range chop | Trades between $4.399 and $4.801 | $4.622 to $4.794 | Breaks either side with volume | Spot volume stays thin |
Bearish breakdown | Trades below $4.399 | $4.250, then $4.040 | Reclaims $4.801 | Long liquidations rise, ETF outflows repeat |
NEAR Price Prediction for November and Year-End
By Nov 28, 10:30 UTC, the base range is $4.399 to $5.450.
Year-end sits between $4.040 and $6.004. The 2027 outlook depends on ETF flows, and the $20 upside debate stays distant, with price 76.96% below $20.42.
A weekly hold over $6.004 would reopen the Oct 12 high zone. Gains of 210.89% year to date aren't forecasts.
Risks That Could Flip the Outlook
Bitcoin sets the tone for altcoins, so a move in the Bitcoin price prediction backdrop can override any NEAR chart.
And leverage cuts both ways. $1.36B of open interest can unwind as fast as it built.
A second ETF outflow would thin the bid. That's a warning, not a crash trigger.
Final Verdict on NEAR Direction
This NEAR Protocol price prediction stays bullish above $4.622, with $4.801 as the trigger and $5.450 as the first real target. A loss of $4.399 cancels it. More setups sit in these other coin forecasts.
Disclaimer: This article is for information only and isn't financial advice. Crypto trading carries high risk, and prices can move fast. Independent research is needed before any decision.



















