XRP On-Chain Activity Holds Up, But Is $1.23 Support Under Threat?

XRP is trading near $1.255, down 0.05% in the last 24 hours. The token closed October with a 16% loss, the fourth-worst October since 2013.
November has started, and traders want to know if the selling is over. The daily chart still looks weak. Other data looks mixed.
Daily Chart Still Shows a Bearish Channel
On the daily chart, XRP price moves inside a descending channel. It has made lower highs since late September.
The token sits below the Bollinger Band middle line at $1.300. It is also close to the lower band at $1.233. The upper band is at $1.367.
RSI reads 37.92. That is weak, but not deeply oversold. A short bounce is possible, yet a real trend change is not confirmed.
Key Levels Traders Are Watching
Type | Level | What It Means |
Resistance | $1.48 to $1.50 | Recovery target if the bearish setup breaks |
Resistance | $1.40 | Sustained move above hurts the bears |
Resistance | $1.30 to $1.35 | Channel top and middle Bollinger line |
Support | $1.23 | Lower Bollinger Band |
Support | $1.18 | Next stop if $1.23 fails |
Support | $1.10 | Deeper downside area |
If price fails at $1.30 to $1.35 and stays inside the channel, a move to $1.23 is possible. Below that, $1.18 and $1.10 come into view.
A strong daily close above $1.35 would change the picture. A sustained move above $1.40 would damage the bearish setup and open room toward $1.48 to $1.50.
Derivatives Data Points to Crowded Long Bets
Futures volume is $1.35 billion, up 54.03%. Open interest is $2.86 billion, up 1.39%. Spot volume is much smaller at $274.76 million.
The overall long/short ratio is 0.8512, so shorts have a small edge across the market. But Binance account data shows 2.5261, and OKX shows 3.84. Binance top traders sit at 3.0161 by accounts and 2.4664 by positions.
Liquidations reached $1.21 million in 24 hours. Longs lost $909.69K, while shorts lost $304.97K.
That mix matters. Many traders lean long while price sits near support. If $1.23 breaks, those long positions could feel pressure.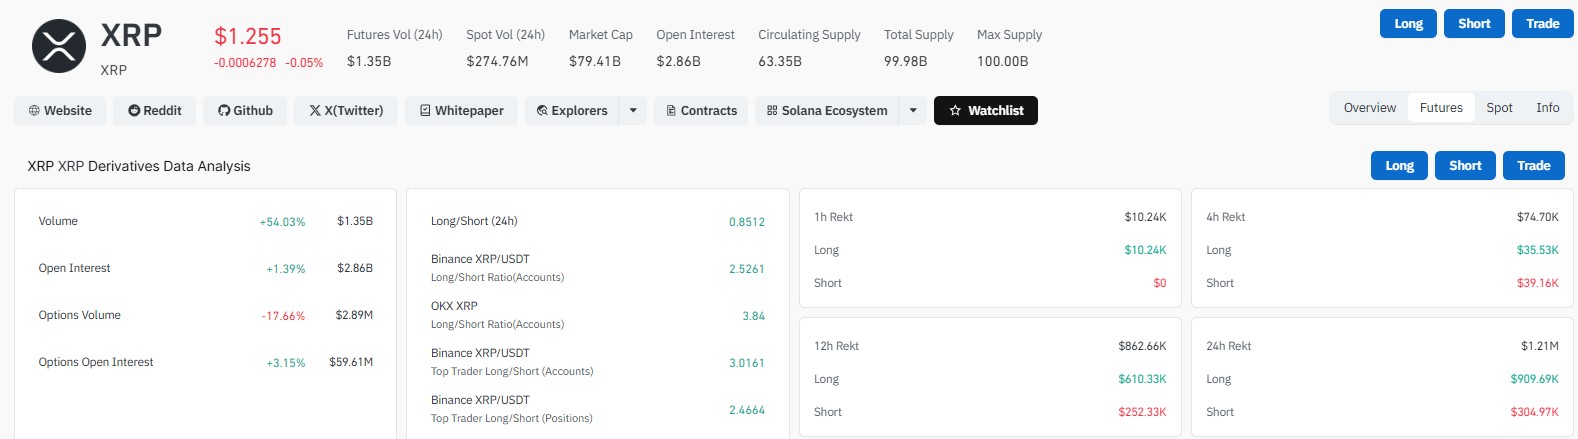
On-Chain Activity Holds Up, But Users Lag
Data shared by BankXRP shows XRPL processing about 3.29 million transactions, with volume near $2.32 billion.
The network is busy. Active address growth is the weak spot, though. Broader adoption still needs to catch up.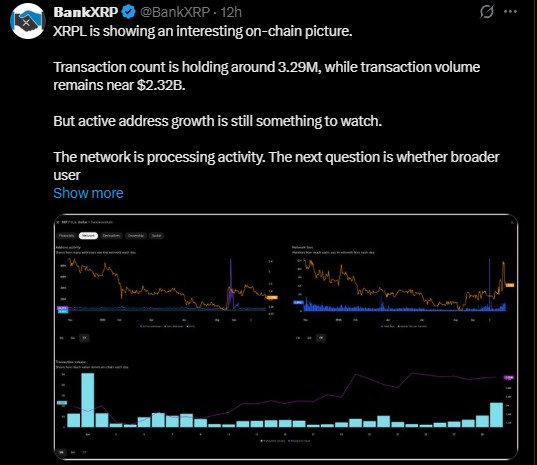
November History Offers Hope, Not a Promise
Since 2013, 13 Novembers are complete. Seven closed red (53.8%) and six closed green (46.2%).
Three red Octobers, in 2013, 2020 and 2024, were followed by big Novembers. Those gains were 489.1%, 179.2% and 282.9%.
The average November return is 78.3%, but the median is negative 9.1%. Four huge months in 2013, 2014, 2020 and 2024 pulled the average up. The median is the safer guide.
Analyst EGRAG Crypto expects a weak first half of November and a stronger second half. That is one view, not a sure thing.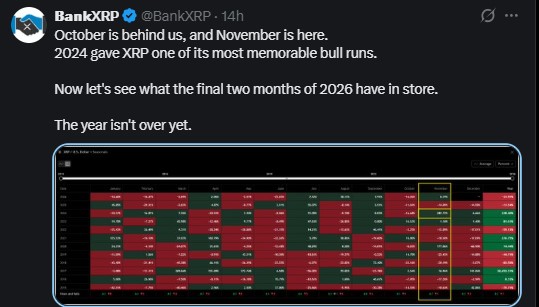
Outlook: Bearish to Sideways Unless $1.35 Breaks
For now, the chart favors a bearish to sideways move, with a possible short bounce. A confirmed break above the channel line would be the first real bullish sign.
Until then, $1.23 is the level to watch.
Disclaimer:
This article is for information only and is not financial advice. Crypto prices are volatile, and you can lose money. Do your own research before you trade or invest.