Ondo Price Prediction October 2026: Can TVL Records Push ONDO $2

Ondo Price Prediction October 2026 is the search heating up, because this chart is sitting at a make-or-break moment.
One level will decide whether the move is real or just noise. Read on before this week's candle closes.
Our editorial desk holds no personal position in this token. This is a chart and data read, nothing more.
Ondo Price Today: Live Price, Volume, and Market Cap Data Explained
The token trades near $0.5022, down 0.18% on the day, per CoinGlass. Market cap is $2.44B.
Futures volume over 24 hours reached $645.15M against $187.38M in spot volume, so derivatives flow runs about 3.4 times spot.
Open interest, the total value of futures contracts still open, stands at $493.88M.
Circulating supply is 4.86B out of a 10.00B maximum, so about 48.6% is already out. Every level below uses the chart CMP (current market price) of $0.5014, not this snapshot.
Source: CoinGlass, October 1, 2026
Ondo News Today: Tokenized Stocks TVL Hits $1.26B Record High
Tokenized stocks are the headline. 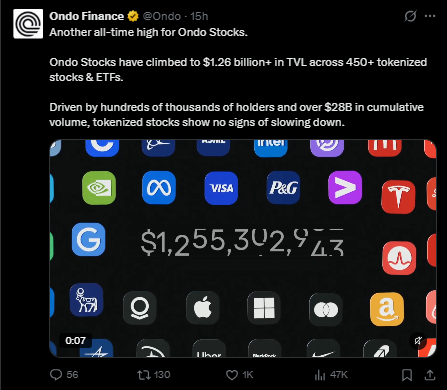
The project's official account (@Ondo) said its stock platform reached another all-time high, with TVL (total value locked) above $1.26B across 450+ tokenized stocks and ETFs. It added that the holder's number is in the hundreds of thousands and the cumulative volume tops $28B.
These are self-reported figures, so treat them as the project's own claim. Platform growth helps the story, but platform TVL and the token's price are different things, and the token still has to capture that demand. Our tokenized stocks explained guide covers how the product works.
Source: the project's official X account, about 15 hours old, October 1, 2026
Ondo Price Prediction Technical Analysis: Weekly Price Forecast
Methodology: 1-week timeframe, Binance perpetual contract, the oscillator panel on the chart, and invalidation set at a 1-week close below $0.2404.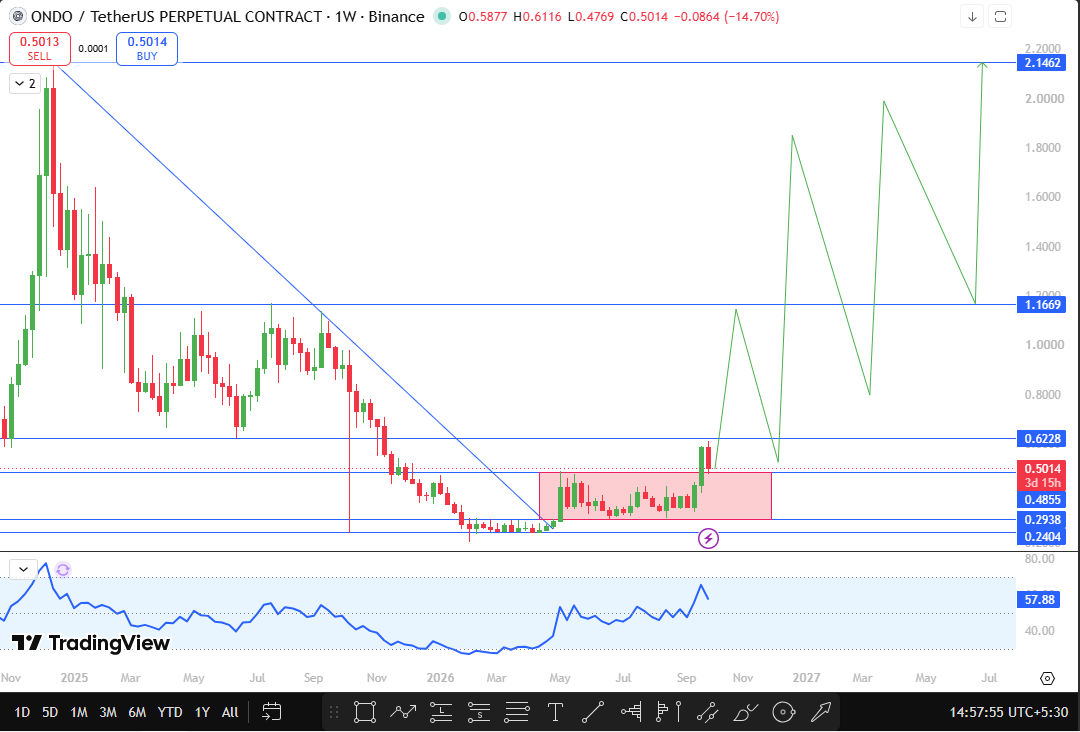
After a long slide from the early-2025 peak, the price broke above the descending trendline and then spent months inside a range between $0.2938 and $0.4855. Last week it broke out of that range on a large candle. This week is the pullback.
The candle is down 14.70% with 3 days and 15 hours left, and its low of $0.4769 dipped just under the $0.4855 range top before the price bounced back to $0.5014.
A retest of the old range top is a normal move after a breakout. A weekly chart trading guide explains why.
The breakout is confirmed only by a 1-week close above $0.6228, about 24.21% above CMP.
That opens a path to $1.1669, about 132.73% above, then the major resistance at $2.1462, about 328.04% above. The projected path on the chart is a staircase. It pulls back first toward the range top, then retests $1.1669 as support before the final leg.
Our breakout retest strategy page shows how traders handle these entries.
The forecast is invalid on a 1-week close below $0.2404, about 52.05% below CMP. A weekly close back below $0.4855, only 3.17% under CMP, would be an early warning that the breakout failed, with the $0.2938 range floor about 41.40% below.
The oscillator reads 57.88, turning down from its recent peak as price pulls back. No divergence labels show on the chart. Momentum is cooling, not broken.
Source: TradingView, perpetual contract 1W chart, Binance, October 1, 2026, 2:57 PM IST
Support and Resistance Levels: Key Ondo Price Targets Explained
Level | Role | Distance from CMP |
$2.1462 | Major resistance | +328.04% |
$1.1669 | Next resistance | +132.73% |
$0.6228 | Breakout confirmation | +24.21% |
$0.5014 | CMP | 0.00% |
$0.4855 | Range top and retest zone | -3.17% |
$0.2938 | Range floor | -41.40% |
$0.2404 | Forecast invalidation | -52.05% |
Ondo Price Outlook: Bull, Base, and Bear Scenarios for the Week
Bull case: A 1-week candle closes above $0.6228. The breakout is then confirmed, and $1.1669 sits another 87.36% above the trigger. After that, $2.1462 is 83.92% higher. Our RWA crypto projects roundup tracks the sector behind the news.
Base case: Price holds near the retest zone and builds a base between $0.4855 and $0.6228. That band is about 28% wide, so expect chop while the market decides. Patience is the cost.
Bear case: A 1-week close back below $0.4855 says the breakout failed, and sellers can then aim at the $0.2938 range floor. Full invalidation only comes below $0.2404.
Ondo Price Risks: What Could Break This Range Breakout Setup
The weekly candle is still open and down 14.70%, so the pullback can deepen before the close.
Open interest equals about 20.2% of market cap, which points to heavy leveraged positioning, so liquidations can move price fast. More than half the supply is still to circulate, which can add selling pressure over time.
The platform figures behind the news are self-reported. This is a weekly read, so moves play out over weeks, and a wider market drop can override it.
Trading Terms Glossary: Breakout, Pullback, and Range Explained
Breakout: price closing beyond a key level, such as a range top or resistance.
Pullback: a short move back toward a level that price just broke.
Range: a sideways zone between a floor and a ceiling where price trades for a while.
Disclaimer
This article is for information and education only and is not financial advice. Crypto is volatile, and you can lose money. Do your own research and speak with a licensed advisor before investing.













.webp)








