PAX Gold Price Prediction: Short-Term Entry Levels Before Next Rally?


Will $3,880 hold? PAXG, a token that tracks one ounce of gold, bounced to the $3,960.21 level on November 2, was rejected there and now trades at $3,913.21 on the 4-hour chart. That is 0.8% above $3,880.17 support and just above a small rising trendline.
In this PAX Gold Price Prediction, the liquidation data shows shorts hit during the bounce and longs hit in the last 12 hours.
Market data checked on November 3, 2026, at 12:47 IST.
PAXG Price Prediction Today: Market Overview
Metric | Value |
Price (TradingView 4-hour chart) | $3,913.21 |
Candle Change | -0.30% |
Candle Open | $3,925.01 |
Candle Range | $3,912.04 – $3,928.82 |
PAXG Liquidation Data
A liquidation is a forced close of a leveraged trade when the trader can no longer cover losses. Longs bet on a rise, and shorts bet on a fall.
Window | Total Liquidated | Long | Short |
12h | $18.31K | $18.05K | $257.59 |
24h | $40.39K | $27.32K | $13.06K |
Source: Data From CoinGlass
Over 24 hours, longs took about 68% and shorts about 32%. In the last 12 hours, longs took about 99%. Nearly all the short liquidations came earlier, which fits the November 2 bounce forcing short sellers out.
The later drop then hit longs. The 24-hour total is about 2.6 times the $15.39K in our November 2 article, but the amounts are still small.
PAXG Price Prediction: Technical Analysis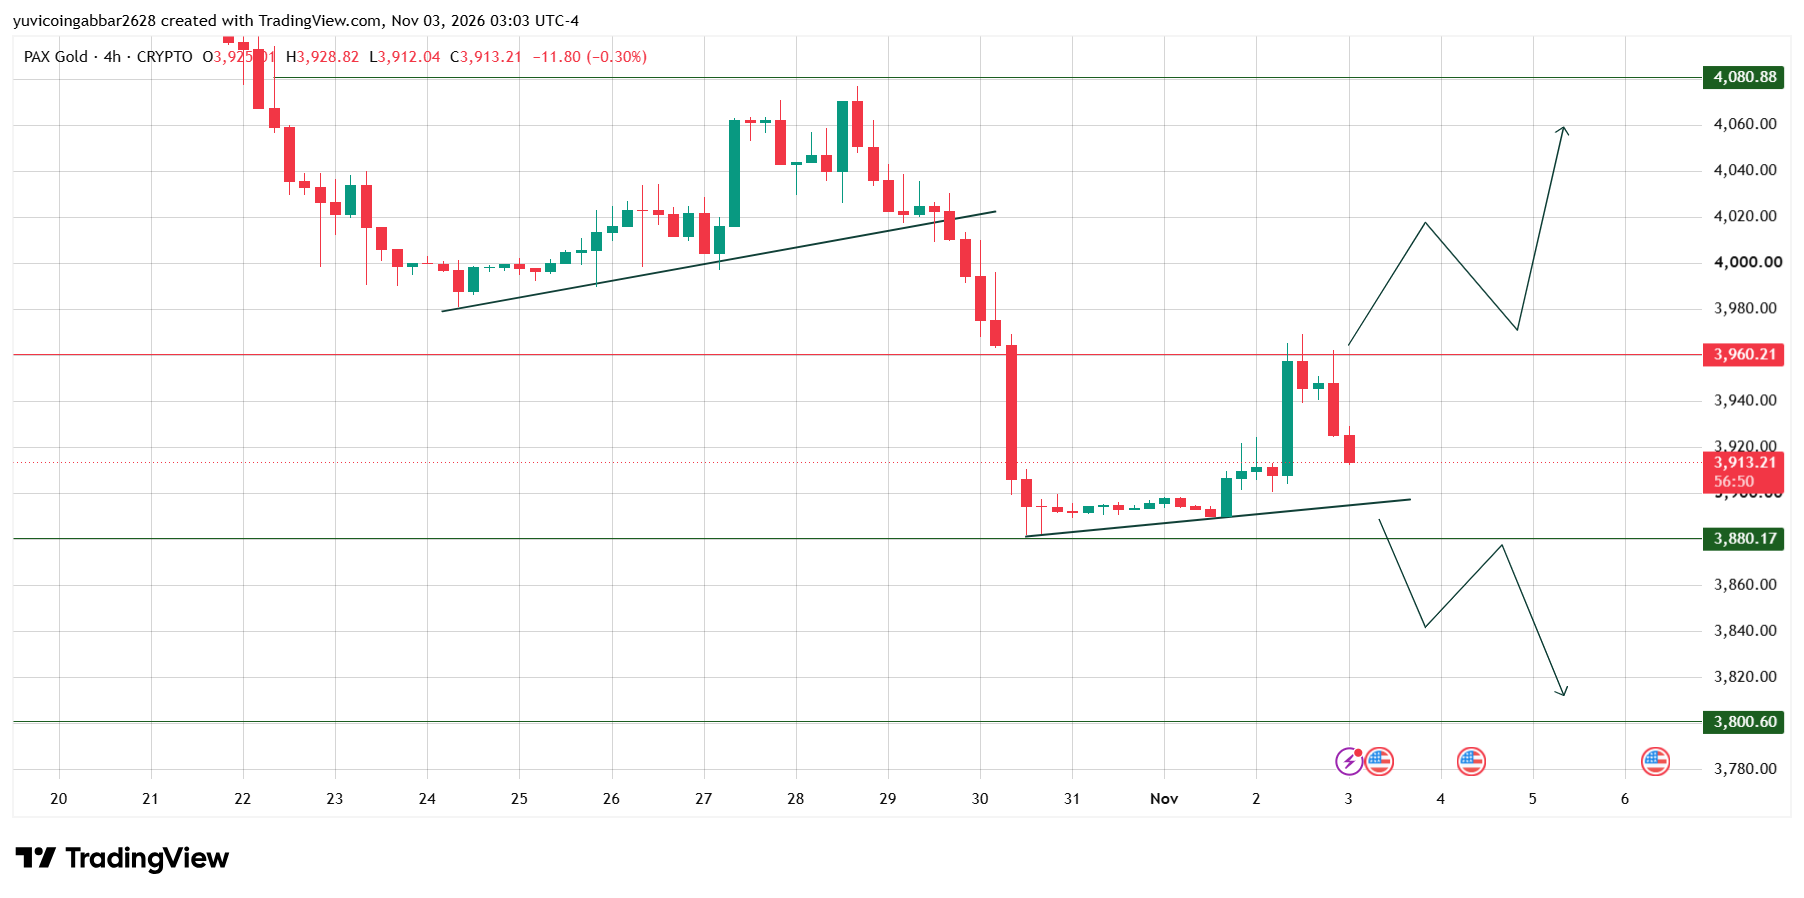
PAXG rose to near $4,080 on October 28, then fell on October 29 and 30 through $3,960.21 to a low near $3,880.17. After that, the price moved sideways in small candles along a rising trendline, a slanted boundary joining higher lows.
On November 2, a large green candle pushed the price up to $3,960.21. Wicks above it reached about $3,965 to $3,970 by eye, but candles did not hold there. Red candles followed.
Today's candle opened at $3,925.01, ranged from $3,912.04 to $3,928.82 and printed $3,913.21. It was still open, so the close can change.
A rally that stops at an old floor is a rejection. Here, $3,960.21 was the floor that broke on October 30, and it has now acted as resistance, a price area where sellers cap rallies.
PAX Gold Forecast: Short-Term Entry Levels Before Next Rally?
Type | Level |
Highest marked level | $4,080.88 |
Resistance 1 | $3,960.21 |
Immediate support | $3,880.17 |
Deeper support | $3,800.60 |
Bull case: A 4-hour close above $3,960.21, about 1% higher, then $4,080.88, about 4% higher, would show buyers regaining control.
Bear case: If $PAXG closes below the rising trendline and $3,880.17, about 1% lower, the price could slide about 3% toward $3,800.60.
$PAXG Scenarios and Invalidation (November 3, 2026)
Scenario | Trigger | Likely Outcome | Invalidation |
Bull | Close above $3,960.21 | Move toward $4,080.88 | Close below $3,880.17 |
Base | Range of $3,880.17 to $3,960.21 | Sideways between the two levels | Break of either level |
Bear | Close below $3,880.17 | Slide toward $3,800.60 | Close back above $3,880.17 |
GOLD Price Prediction: Can PAXG Reach $4,080.88?
It would take a gain of about 4% from $3,913.21. Any PAXG price prediction toward that level needs more than a bounce, since $PAXG must first close above $3,960.21, where it was just rejected.
PAX Gold Price Prediction: Expert View
$PAXG is trading in a tight range between two clear levels. The rejection at $3,960.21 leans bearish, but $3,880.17 has held since October 30. The 4-hour chart reacts fast, so signals can flip within a day.
The level to watch is $3,880.17. A 4-hour close below it would open $3,800.60, while a close above $3,960.21 would be the first real sign of strength.
Disclaimer
This article is for informational purposes only and isn't financial advice. Crypto and gold markets are volatile. Always do your own research before making any trading decisions involving PAXG.