PAX Gold Price Prediction October 2026: Can PAXG Hold $4,000 Support?


PAXG dropped 2.7% in one day and is now at its lowest level since early August. This PAX Gold Price Prediction October 2026 looks at whether $4,100 holds or whether the price heads for the big $4,000 support zone.
Gold Price Today: Technical Analysis
PAXG rallied hard in August, going from about $4,050 to a high near $4,690. Sellers stopped it at the $4,700.23 zone, and the price has been falling since.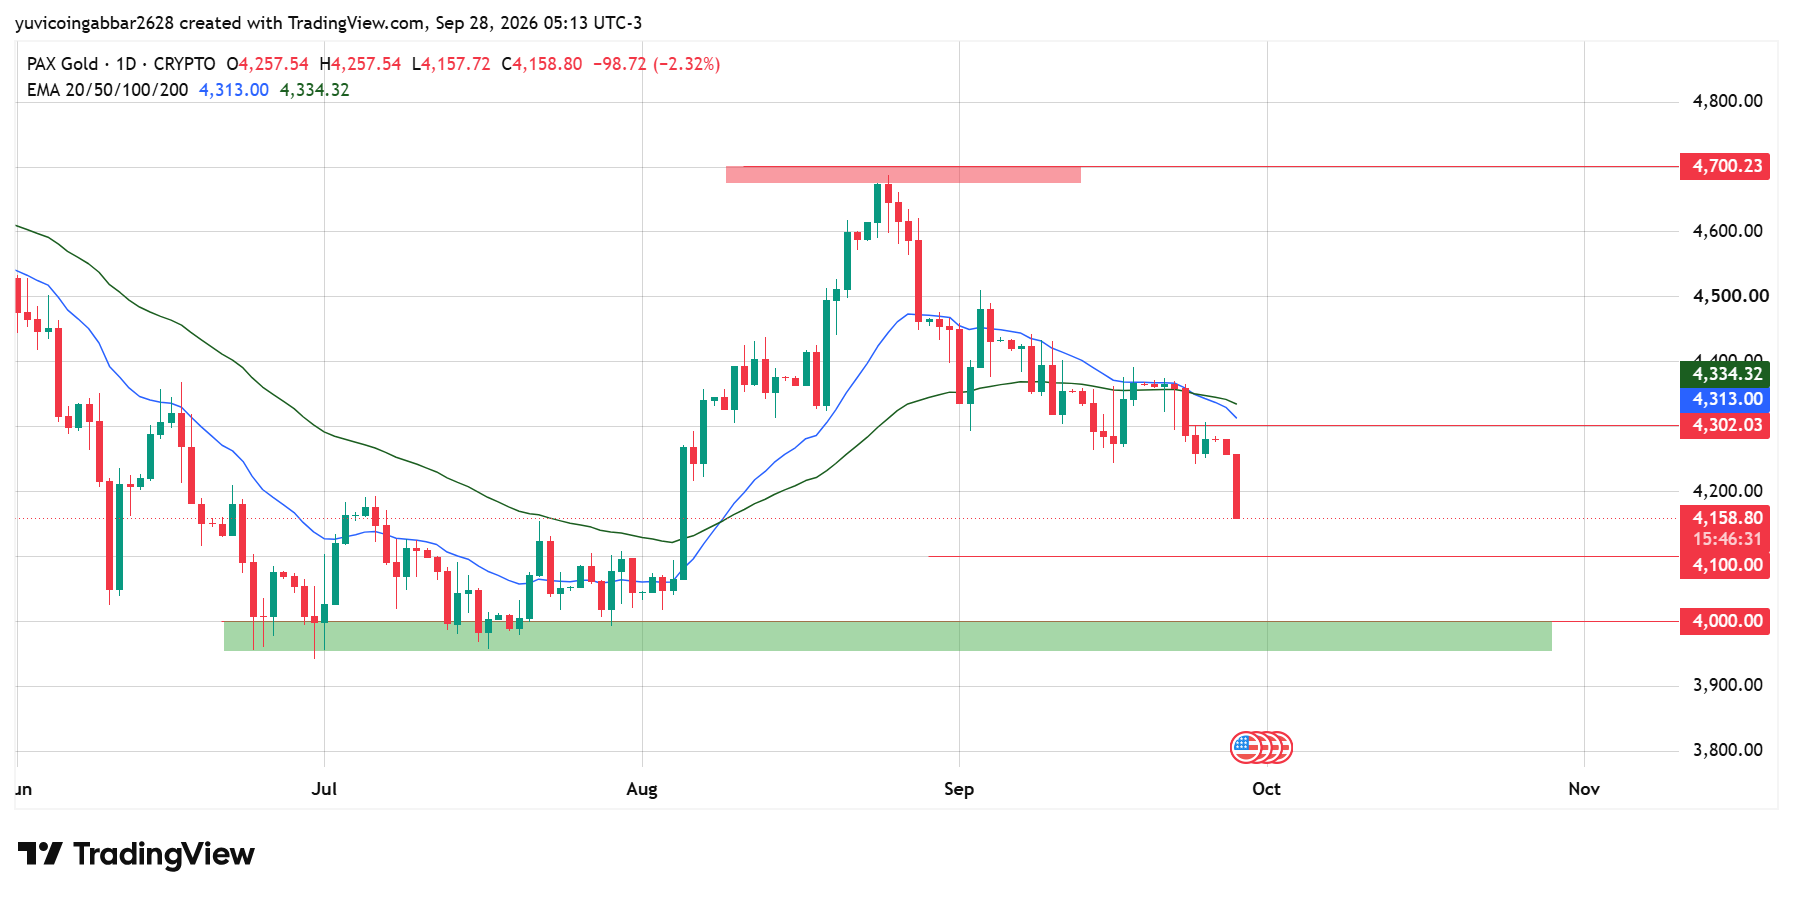
That drop has come in steps. Each bounce has topped out lower than the one before: near $4,510 in early September, near $4,390 in mid-September, and near $4,300 last week.
Today's candle is the biggest drop in weeks.
PAX Gold price today fell 2.7% to $4,158.80 and closed below the $4,302.03 level, which had held as support for several days. It is now the lowest price since the early August jump.
Two EMAs now sit above price. The 20 EMA is at $4,313.00 and the 50 EMA is at $4,334.32. The 20 EMA has also slipped below the 50 EMA, which traders read as a sign that the short-term trend has turned down.
Below the price, the next level is $4,100.00 support. Price bounced from this zone three times, in late June, mid-July, and early August, so it is the main floor for the whole chart.
PAXG Outlook Key Levels
Level Type | Price |
Resistance 3 | $4,700.23 |
EMA Resistance Zone | $4,313.00 to $4,334.32 |
Resistance 1 (nearest) | $4,302.03 |
$4,158.80 | |
First Confirmed Support | $4,100.00 |
Major Support Zone | $4,000.00 |
PAXG Price Forecast
Bull case: If the price holds $4,100.00 and bounces, the first job is to take back $4,302.03. A close above the EMAs at $4,313.00 and $4,334.32 would show buyers are back in charge. From there, $4,700.23 would come into view.
Bear case: A close below $4,100.00 would send the price toward the $4,000.00 zone. If that zone breaks, PAXG would lose the floor that has held since June, and no other support is marked below it on this chart.
PAX Gold Price Prediction October 2026: Can PAX Gold Reach $4,700?
$4,700.23 is the highest level marked on the chart. To reach it, PAXG must first take back $4,302.03, then clear the EMAs near $4,334, and finally break the August high zone. That is a lot of ground to cover from $4,158.80.
PAX Gold Price Prediction: Expert View
According to CoinGabbar analysts, the trend has turned down, with lower highs, a bearish EMA cross, and a strong red candle today. That does not mean the fall must continue.
The $4,000 zone has held three times, so buyers may show up there. The next few closes near $4,100 will tell us more than today's drop alone.
Disclaimer
This piece is for informational purposes only and isn't financial advice. The levels and scenarios above are based on technical chart analysis and publicly available data at the time of writing. Gold-linked assets can move sharply on macro and currency news, so past patterns don't guarantee future outcomes. Do your own research and consider your risk tolerance before acting on any level discussed here.

















