PAXG Price Prediction: Will PAX Gold Make a New Low Below $3,880?

Will PAXG make a new low? On the daily chart, it already broke the floor it held since late June. A large red candle closed under $3,960.21, and PAXG, a token that tracks one ounce of gold, now trades at $3,893.30.
The next test is $3,880.17, just 0.3% below. If that fails, $3,702.39 sits about 5% lower. This PAXG Price Prediction maps the levels for a new low and for a recovery.
Market data checked on October 31, 2026, at 16:43 IST.
Why is PAX Gold price down today?
PAX Gold price today is down 2.23% to $3,893.30 in 24h, underperforming a slightly lower Bitcoin, primarily driven by negative sentiment and reduced utility following the massive Binance security breach.
Primary reason: Direct exposure to the Binance hack fallout, including a freeze of over $8 million in PAXG tokens by issuer Paxos.
Secondary reasons: Precautionary lending restrictions on Aave and a broader risk-off move across crypto markets.
Market Backdrop: Fed and Binance
The Fed held its rate at 3.75%–4.00% on October 28 in a 10–2 vote, with two officials wanting a quarter-point hike. Higher rates can weigh on gold, which pays no interest.
Binance's October 29 security incident also remains a risk for crypto-traded assets.
PAXG Price Prediction: Technical Analysis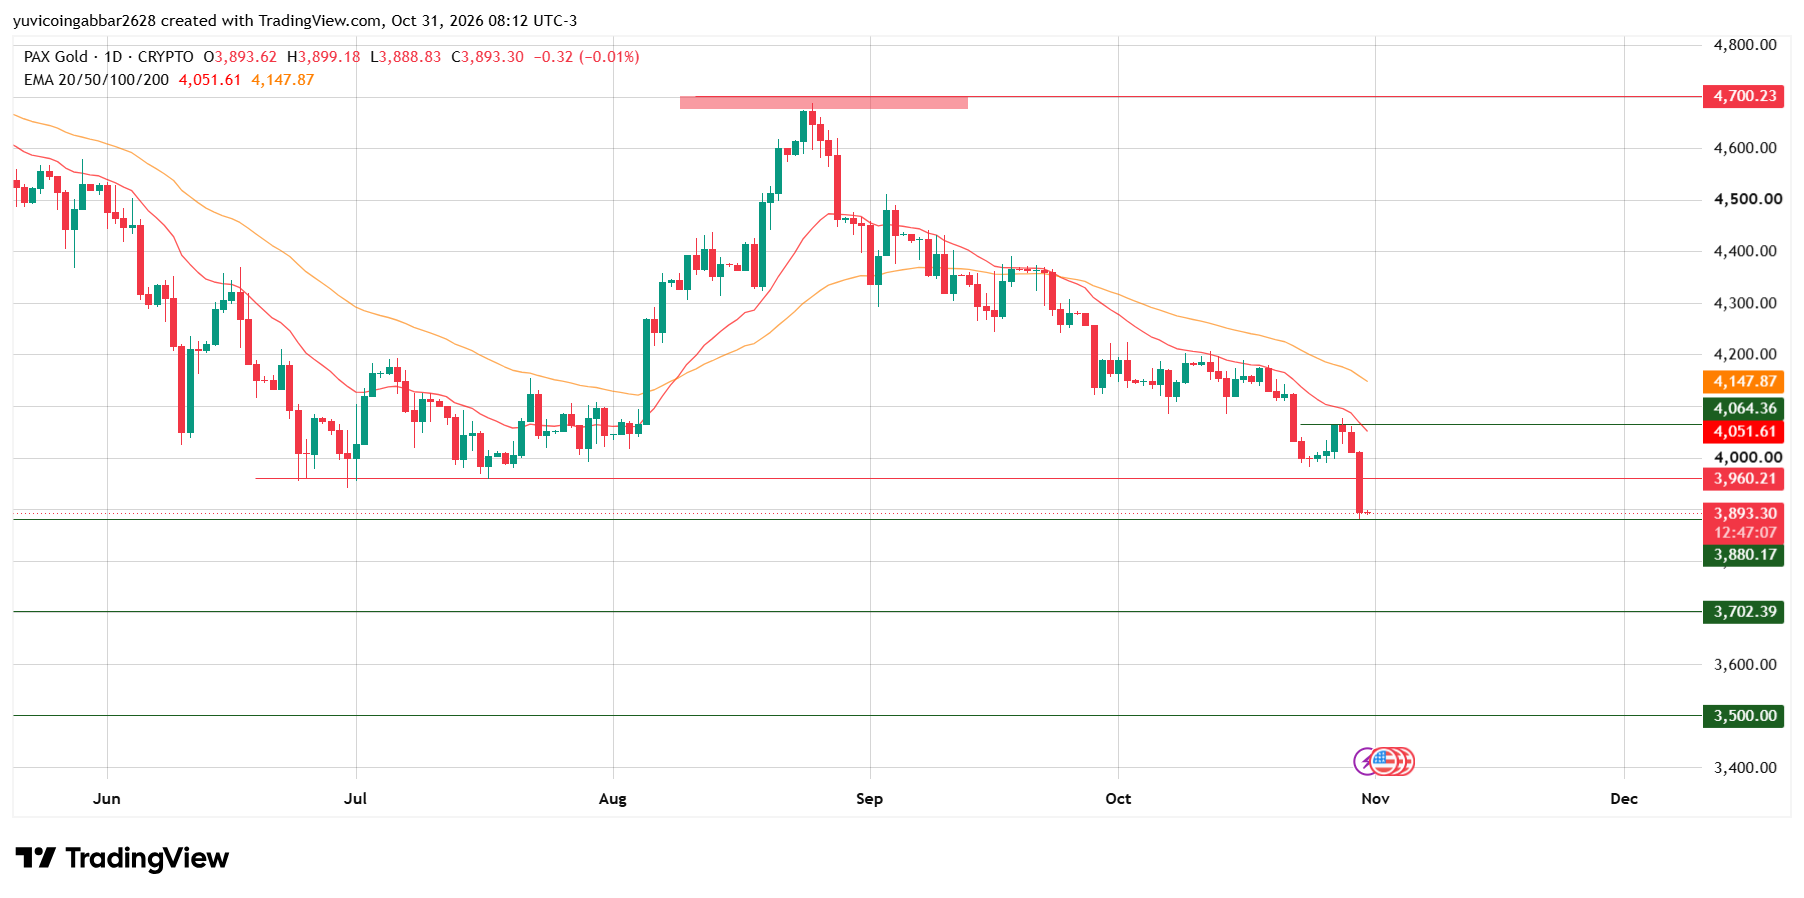
PAXG peaked near $4,700 in August, then fell in steps. Through June and July it held a floor near $3,960.21, with several lows touching that area. In October, it slid toward that floor again and bounced to about $4,070.
Today's candle reached $3,899.18 and $3,888.83, then printed $3,893.30. It was still open, so the close can change. In our October 30 article on the 4-hour chart, $3,960.21 was the support to watch, and it has now broken.
A price that falls below an old floor has made a lower low, a new low under the previous one. A broken floor often becomes resistance, an area where sellers cap rallies.
An EMA, or exponential moving average, weights recent prices more heavily. Price is about 4.1% under the 20 EMA $4,051.61 and 6.5% under the 50 EMA $4,147.87. The 20 EMA sits below the 50 EMA, a bearish order.
Will PAXG Make a New Low? Downside Levels
Level | Distance From $3,893.30 |
$3,880.17 | About 0.3% lower |
$3,702.39 | About 4.9% lower |
$3,500.00 | About 10.1% lower |
The first level is very close, so a small dip would reach it. A daily close below $3,880.17 would open $3,702.39. A close back above $3,960.21 would turn the break into a failed breakdown.
PAXG Forecast: Support and Resistance Levels
Type | Level |
Highest marked level | $4,700.23 |
Resistance 3 | $4,064.36 |
Resistance 2 | $4,000 (round number) |
Resistance 1 | $3,960.21 |
Immediate support | $3,880.17 |
Deeper support | $3,702.39 |
Lowest marked level | $3,500.00 |
Bull case: A daily close above $3,960.21, about 2% higher, then $4,000, would put the 20 EMA at $4,051.61 and $4,064.36 in view.
Bear case: If PAXG closes below $3,880.17, the price could slide about 5% toward $3,702.39.
PAXG Scenarios and Invalidation (October 31, 2026)
Scenario | Trigger | Likely Outcome | Invalidation |
Bull | Close above $3,960.21 | Move toward $4,051.61 and $4,064.36 | Close below $3,880.17 |
Base | Range of $3,880.17 to $3,960.21 | Sideways under the old floor | Break of either level |
Bear | Close below $3,880.17 | Slide toward $3,702.39 | Close back above $3,880.17 |
PAX Gold Price Prediction 2026: Can PAXG Reach $4,700.23?
It would take a gain of about 21% from $3,893.30. Any PAX Gold price prediction toward that level needs more than a bounce, since PAXG must retake $3,960.21, $4,000, both EMAs and $4,064.36 first.
PAXG Price Prediction: CoinGabbar Technical
The break of a four-month floor, the bearish EMA order and a close under $3,960.21 lean bearish.
The level to watch is $3,880.17. A daily close below it would open $3,702.39, while a close above $3,960.21 would be the first real sign of strength.
Disclaimer
This article is for informational purposes only and isn't financial advice. Crypto and gold markets are volatile. Always do your own research before making any trading decisions involving PAXG.