Pi Network Price Prediction: Token Unlocks Spark Fresh PI Crash Fear?


Two posts pull PI in opposite directions. One calls Pi Ventures bullish. The other asks whether token unlocks or Pi Core Team selling are hurting holders. Which one explains the price? Neither gives data.
The daily chart shows PI slipping under its sideways range, so sellers have the edge for now. This Pi Network price prediction checks both claims against the chart, then lists the levels that matter next.
Market data checked on October 26, 2026, at 10:05 IST.
Pi Network Price Prediction Today: Market Overview
Metric | Value |
Price (TradingView OKX daily chart) | $0.07519 |
Daily Candle Change | -2.82% |
Candle Open | $0.07527 |
Candle Range | $0.07432 – $0.07594 |
Why is PI’s price down today?
Pi Network price today is down 2.82% to $0.07519 in 24 hours, underperforming a broadly weaker crypto market, primarily driven by a technical breakdown below key support amid a lack of fresh catalysts.
Reason: Broader market sell-off and technical breakdown. Pi broke below the 0.07696 support zone as Bitcoin and total market cap fell.
Pi Network News Today: Post Links Pi Ventures to Axis Robotics
A account on X posted that Pi Core Team's Pi Ventures "was bullish" on Axis Robotics. The post says Axis Robotics has been on a tear, announcing large partnerships and a token called $AXIS.
Source: Data From X
It names no deal size, price or date, so CoinGabbar could not verify it. A partnership at another project does not by itself create demand for PI.
PI News: Token Unlock and Selling Claims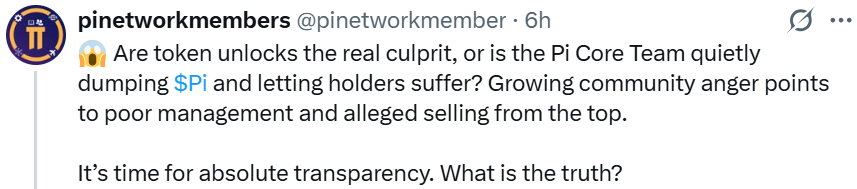
A post on X, asks whether token unlocks are the real culprit or whether the Pi Core Team is quietly selling PI. It cites growing community anger and alleged selling from the top.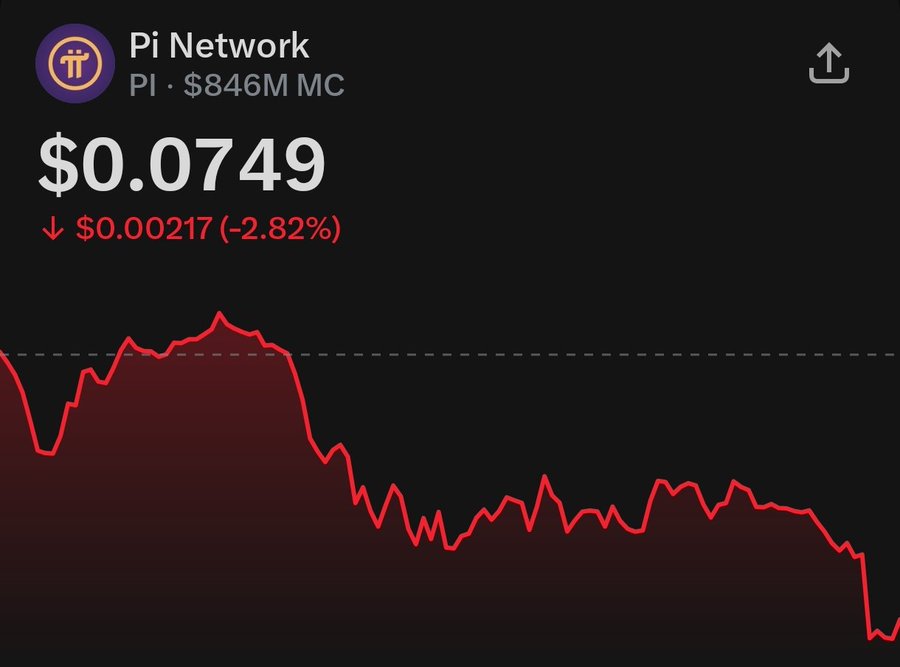
A token unlock releases coins that were locked, which can add supply to the market. The post shows no wallet data, amounts or dates, so these are allegations, not facts.
Pi Network Outlook: PI Slips Below Its Consolidation Range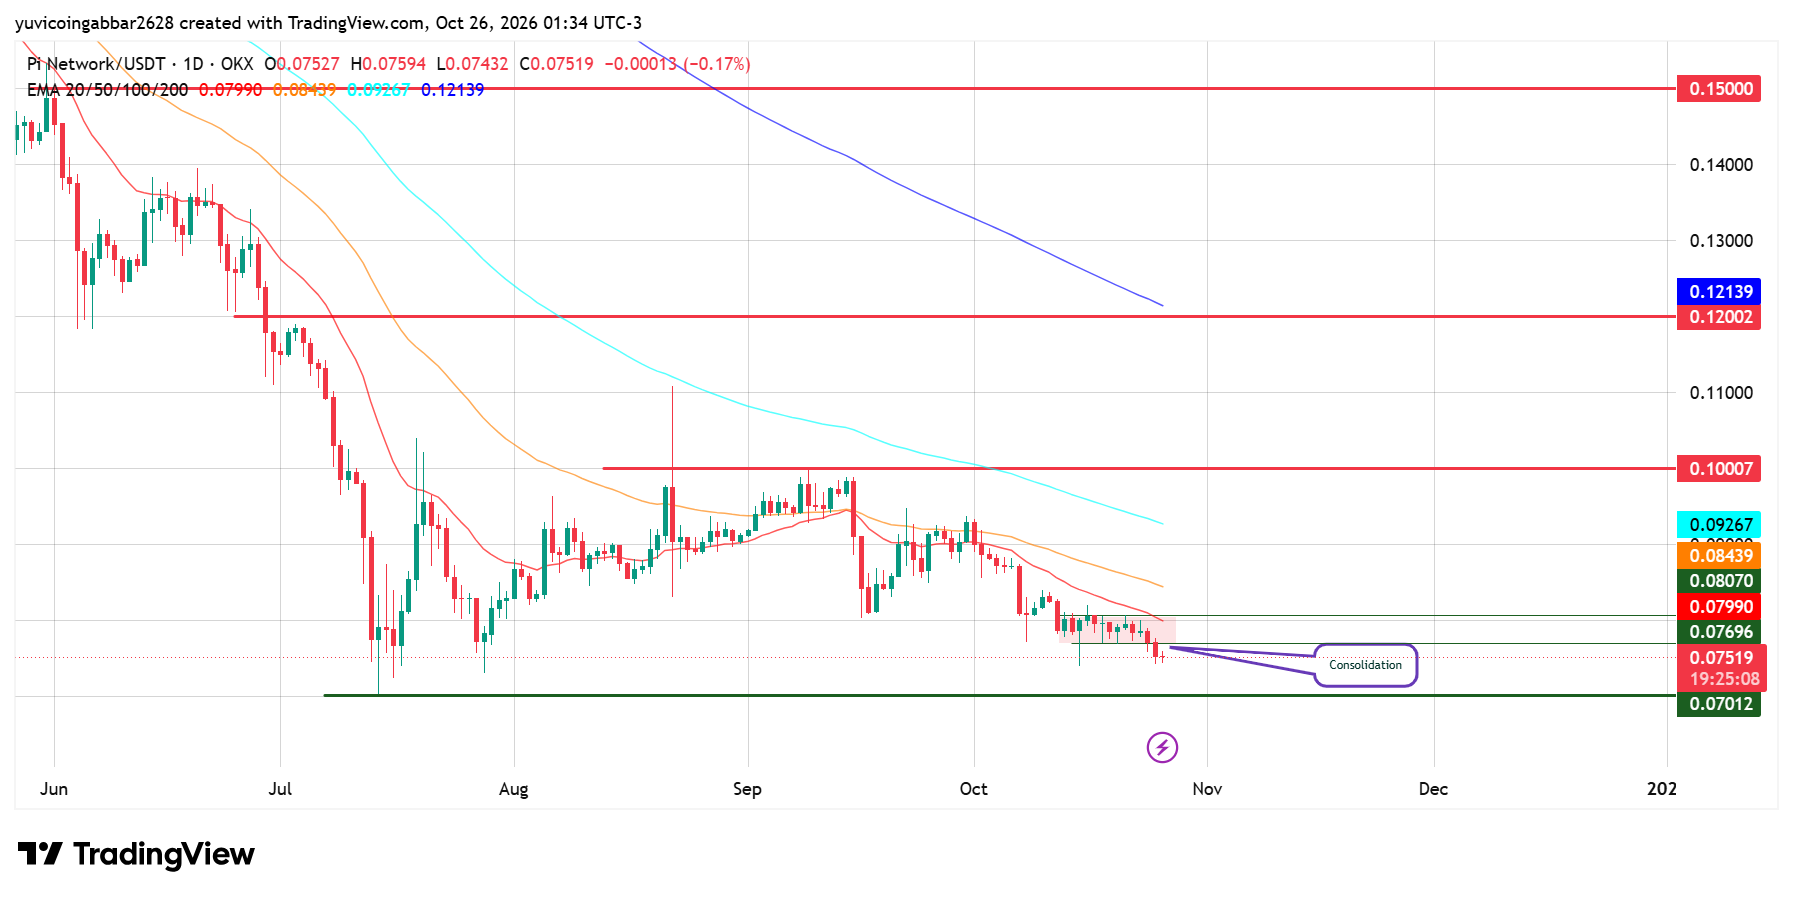
Consolidation means the price moves sideways in a tight range while traders wait for a direction. $PI traded between $0.07696 and $0.08070 from mid-October.
The price has broken down from its consolidation range and is trading sharply lower. The key level to watch is the $0.07012 support. If buyers fail to defend this zone and price breaks below it, selling pressure could accelerate and trigger a deeper decline.
Today's candle opened at $0.07527, ranged from $0.07432 to $0.07594 and printed $0.07519, under the range floor.
An EMA is a trend line that weights recent prices more heavily. All four EMAs slope down and sit above price, with the 20 EMA about 6.3% higher.
EMA | Value | Position vs Price |
EMA 20 (red) | $0.07990 | Above price |
EMA 50 (orange) | $0.08439 | Above price |
EMA 100 (cyan) | $0.09267 | Above price |
EMA 200 (blue) | $0.12139 | Above price |
Pi Network Forecast: Support and Resistance Levels
Type | Level |
Highest marked level | $0.15000 |
Higher resistance | $0.12002 |
Resistance 2 | $0.10007 |
Nearest resistance | $0.08070 |
Range floor (now overhead) | $0.07696 |
Support | $0.07012 |
Bull case: A daily close back above $0.07696 would return $PI to its range. A close over $0.08070, just above the EMA 20 at $0.07990, would then test the EMA 50 at $0.08439.
Bear case: If $PI closes below $0.07012, the green support line that began in July would fail. The chart marks no level under it, so the price would be in untested territory.
PI Scenarios and Invalidation (October 26, 2026)
Scenario | Trigger | Likely Outcome | Invalidation |
Bull | Close above $0.08070 | Move toward $0.08439, then $0.09267 | Close below $0.07696 |
Base | Range of $0.07012 to $0.07696 | Sideways under the old floor | Break of either level |
Bear | Close below $0.07012 | Fresh lows with no marked support | Close back above $0.07012 |
Pi Network Price Prediction: Can $Pi Network Reach $0.10007?
It would take a gain of about 33% from $0.07519. Any Pi price prediction toward that level needs more than headlines, since $PI must reclaim $0.07696, clear $0.08070 and pass the EMAs up to $0.09267 first.
The $0.15000 mark would mean a gain of about 99%. A partnership post does not guarantee that path.
Pi Network Price Prediction 2026: Expert View
Price sits under all four EMAs and below its range, so a daily close back above $0.07696 would be the first sign of relief, and a close below $0.07012 the next sign of weakness.
Disclaimer
This article is for informational purposes only and isn't financial advice. Crypto markets are volatile. Always do your own research before making any trading decisions involving PI.

















